Healthspan vs Lifespan: My FIRE Plan Funds Me to 90 and Assumes a Body It Never Modeled
 Dennis Vymer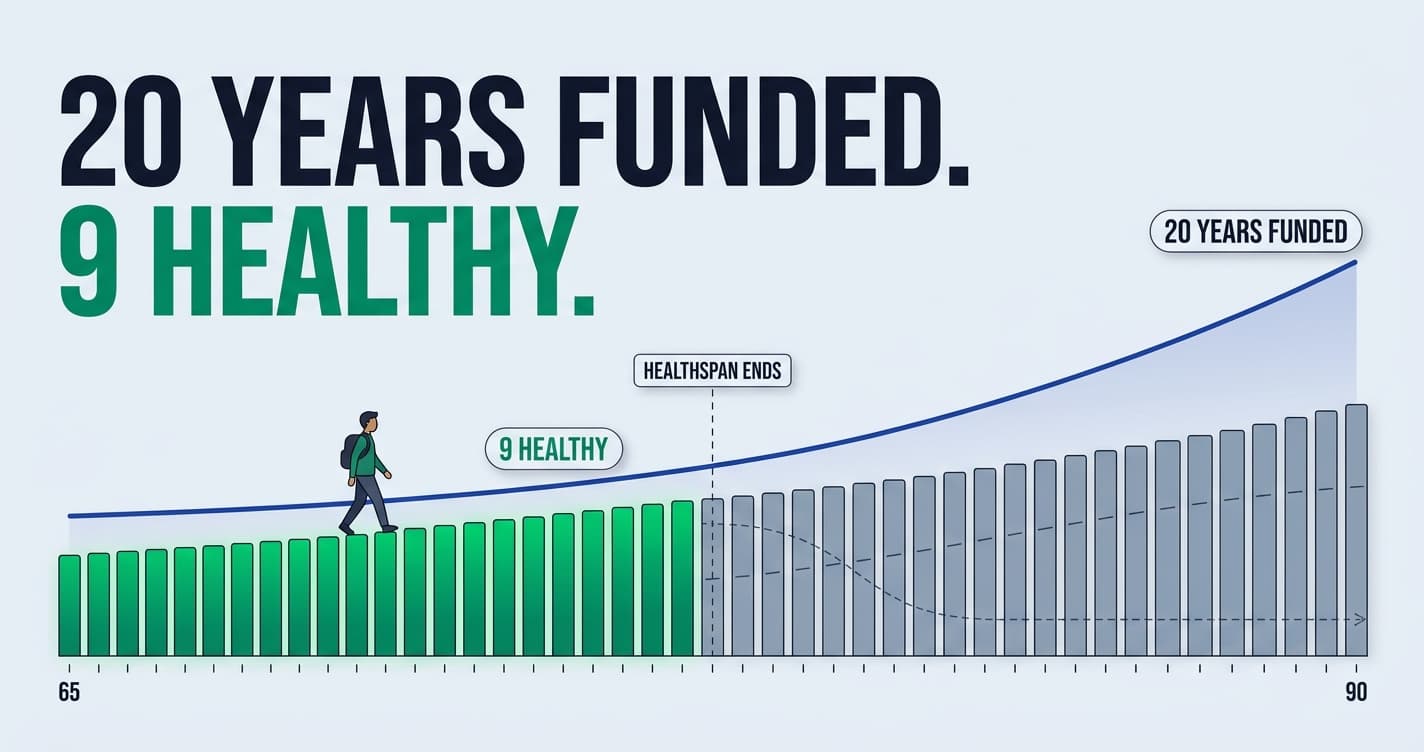
Two Sundays ago I spent the better part of an hour arguing with myself about whether to run our plan at a 5% real return or 4.7%. Then I scrolled up through the input list and counted what else was in there.
Expected return. Inflation. Contribution growth. Withdrawal rate. The second house and its remaining twelve years. Currency. One-off expenses. A sequence-risk buffer I read three papers to justify. A dozen assumptions, every one defended, some to a tenth of a percent. Not one of them describes the person who spends the money.
Healthspan vs lifespan is the name for what's missing, and until this summer I had never typed either of them into anything I've built.
The argument was with myself, by the way, not my wife. Our daughter was asleep, the flat was quiet, and this is what I do with quiet hours now. Somewhere in there it landed that if my return assumption is wrong by 0.3 percentage points, the plan is a bit late or a bit early. If the body assumption is wrong, the plan is pointed at years that don't exist.
My model funds me to 90. It has no opinion at all about whether I can carry my own suitcase at 78, or stand in front of a class for six hours at 55 — which, since I've already published what the money is actually for, isn't a rhetorical example. It's the job.
This is a confession, not a transformation story. I have nothing to report about my own health and I'm not going to invent anything. What I have is a hole in something I built.
Healthspan vs lifespan, and the subtraction that ruined my afternoon
Two plain definitions, because everyone writing about this makes them sound clinical. Lifespan is how many years you're alive. Healthspan is how many of those years your body isn't the thing deciding what you do. The difference is the part your plan funds and you won't be able to use.
The best measurement comes from a paper I'd never have found from the finance side. Garmany and Terzic, JAMA Network Open, December 2024, covering all 183 WHO member states. The global gap in 2019 was 9.6 years, up from 8.5 in 2000, a 13% widening in two decades. Over those same twenty years, global life expectancy rose 6.5 years while healthy life expectancy rose only 5.4. We're adding years faster than we're adding usable ones.
Now the part that made me put my coffee down: the countries with the biggest gaps are the rich ones. The United States carries the largest in the world at 12.4 years, with Australia, New Zealand and the UK close behind between 11.3 and 12.1. The smallest gaps belong to Lesotho, the Central African Republic and Somalia, between 6.5 and 6.8 years, not because anyone there is healthier but because people die before the chronic-disease decade arrives. A small gap is a catastrophe, not a win. Wealth buys you years, and a disproportionate share of them are years you can't spend.
 Data: WHO Global Health Observatory, life expectancy and healthy life expectancy at birth, both sexes, 2021. This is WHO's current series; the peer-reviewed 12.4-year US figure quoted above comes from an earlier vintage and the two shouldn't be mixed. The 2021 values are depressed by COVID-19 mortality across the board.
Those are numbers measured at birth: interesting, not actionable. Here's the version that maps onto a retirement projection.
Eurostat publishes healthy life years at 65. It also publishes life expectancy at 65. Subtract one from the other: an EU citizen reaching 65 in 2023 had 20.0 years left, of which 9.4 were healthy. Ten and a half years with an activity limitation. Fifty-three percent of everything after 65 is time the data does not expect you to be able to use properly.
 Data: Eurostat (tepsr_sp320 and demo_mlexpec), both sexes, 2023. Healthy life years come from a self-reported activity-limitation question, so cross-country comparison is directional rather than precise.
Sweden gets 13.9 good years out of 20.9. Czechia, where I live, gets 7.7 out of 18.7. Same continent, six years of difference in the part that matters and barely two in the part every plan is built on.
The standard FIRE number calculation multiplies your annual spending by 25 and hands you a target with no term in it for capability. It assumes the years are interchangeable, which is the one assumption population health data exists to refute.
Your body has sequence-of-returns risk too, and no catch-up contribution
Every FIRE plan I've read, mine included, treats the decline as something that happens neatly at the far end. Eurostat's disability data says it doesn't.
 Data: Eurostat hlth_silc_12, EU-27, both sexes, all income quintiles, 2023.
Read that against a plan. At 55 to 64, the band where most FIRE plans mature and the good part is supposed to start, a third of the population already reports an activity limitation. By 85, three in four do. One in three has a severe one. And the model is still solemnly compounding through that decade at 5% real, planning holidays.
The retirement world calls the phases go-go, slow-go and no-go, from Michael Stein's The Prosperous Retirement. The detail everyone drops is that the transitions are usually triggered by an abrupt health event rather than by smooth decline. Something happens on a Tuesday and you're in the next phase.
That is sequence-of-returns risk applied to a person instead of a portfolio. The order in which the bad years arrive changes the outcome far more than the average does: two people with identical average health across their sixties and seventies get completely different retirements depending on whether the bad stretch lands at 62 or at 79.
Then the analogy stops being cute. A portfolio has recovery mechanisms: save more, work an extra year, cut spending, take a job at 58 you didn't plan on. None of them exist for the body. No lump sum, no backdated deposit, no catch-up contribution for the decade you spent at a desk, and no product that will sell you one whatever the ads say.
It's the only asset in the plan where the accumulation window closes and doesn't reopen.
"I'll sort my health out after I hit the number" is the same sentence as "I'll invest when the market calms down"
I've written before about the years when my net-worth line refused to move, and what got me through them was realising that at small balances you are the compounding. That phase looks flat by design, and the people who quit in it quit because nothing visible is happening.
The body works the same way and I didn't notice for years.
Look back at that age curve. At 16 to 44, 11.9% of people report a limitation; at 45 to 54, 21.2%. Those are the accumulation years: nothing visible happening, all of the compounding happening anyway. So "I'll get in shape once we hit the number" is structurally identical to "I'll start investing once the market calms down." In both cases the deferred period is the compounding period, and the person deferring isn't being lazy. They're being reasonable in a way that quietly costs them the only thing that was ever scarce.
The accumulation phase also sends its own bill, and I have only ever counted it in savings-rate terms. A cohort study of 481,688 people, mean follow-up just under 13 years, found that people who predominantly sat at work carried 16% higher all-cause mortality and 34% higher cardiovascular mortality than people who didn't, after adjusting for age, sex, education, smoking, drinking and BMI.
I sit for a living. I built the tracker in evenings, after work, with a newborn in the house, and I paid for it in sleep and in hours that never went anywhere near a spreadsheet I've opened.
The same study found an extra 15 to 30 minutes of physical activity a day brought the sitters level with the non-sitters. Fifteen minutes is about 1.6% of your waking hours, and I have genuinely spent longer than that comparing a fund charging 0.07% to one charging 0.12%.
The dose-response data points the same way. An analysis of over 100,000 adults tracked for 30 years, published in Circulation in 2022, found the standard guideline of 150 to 300 minutes of moderate activity a week associated with 20 to 21% lower all-cause mortality. Two to four times the guideline got you to 26 to 31%. Past that, nothing. The curve flattens, which is the opposite shape from investing, where more is more and the whole game is staying in longer. Nearly all the return sits in the first slice, and the optimisers are grinding away in the flat part.
A protected health line is not lifestyle creep, and here's what it costs your FIRE date
Most advice here is wrong in a specific, boring way. Health spending gets filed under self-care, which puts it in the same mental drawer as a nicer holiday rather than the drawer with the rent and the ETF transfer. So it dies quietly in the first belt-tightening round of every year.
That filing is backwards, not because health spending is virtuous but because it's the only line in the budget buying an asset with no catch-up mechanism. I'd also be doing what I criticise other people for if I told you to add a budget line without pricing it. Money spent at 35 doesn't compound to 65. That's a real cost, so here it is.
 Data: modelled from the stated assumptions (EUR 1,000,000 target, EUR 30,000 saved a year, 5.0% real return) — illustrative figures, not empirical data.
A hundred euros a month costs about six months of FIRE date on a twenty-year plan. Four hundred costs a bit over two years, which is genuinely expensive and I'm not going to pretend otherwise. Set that against a gap measured in a decade — six months of date, against ten years of capability. I don't think the exchange rate is close, and I say that as somebody who has cheerfully spent an hour on 0.3 percentage points.
One thing before anyone goes shopping. The 2024 Lancet Commission on dementia concluded that around 45% of cases are potentially preventable through 14 modifiable risk factors. Go down that list and count how many you can buy: hearing and vision. That's it. Hearing aids and glasses are not luxury goods, and most people defer both for years out of vanity or inertia. The other twelve are behaviour, environment, education and time. The intervention set was never a shopping list.
The obvious thing about my own tool, then I'll move on. I build a tracker that models money out to 90 and contains nothing about the years, and I'm not shipping a healthspan module either, because I don't know what it would honestly do. What I did add, for myself, is a note on the projection screen marking the years the data doesn't expect me to be able to use. It changed how I read that chart more than any assumption I've ever argued about.
The best argument against this entire article
It isn't the wellness industry, though we'll get there. It's genetics, and the evidence moved in that direction seven months ago.
In January 2026, Science published a paper by Shenhar and colleagues arguing that every heritability estimate for human lifespan has been biased downward, because they all lump intrinsic biological death together with extrinsic causes: accidents, infections, violence. Strip out the extrinsic mortality using twin cohorts raised together and apart, and their estimate for the heritability of intrinsic human lifespan comes out above 50%. Roughly double the 20 to 25% figure that has been the working consensus for decades.
Sit with what that does to my argument. I've spent this article proposing a protected budget line and a defended calendar block, aimed at an outcome that may be more than half decided by a dice roll thrown before I was born. That's not a savings-rate calculation. That's a direct debit with a superstition attached.
I can answer it, and the answer doesn't fully make it go away.
The paper is about lifespan, not healthspan, and specifically about intrinsic mortality: a finding about when you die, not about how many of your years are good ones. Those are different quantities and the second one is what this article is about. Even taking 50%-plus at face value, half the variance still isn't genetic, and the Lancet's 45%-of-dementia-is-modifiable sits squarely in that half. Heritability describes variance across a population; it has never been a ceiling on an individual. All of that is true and it still stings, and if it didn't sting I'd be misreading the paper.
The second objection is commercial, and I take it seriously because I've been on the wrong side of a hype cycle before. The global wellness economy hit $6.8 trillion in 2024, double its 2013 size and nearly four times the pharmaceutical industry. An industry that size has an enormous interest in convincing you that healthspan is a purchase, and telling a personal-finance audience to open a health budget line does its demand generation for free, with the extra trick of laundering the spending through a savings-rate argument so it doesn't feel like spending.
My answer is the dementia list again. The things a health line most likely buys, meaning supplements, biomarker panels, wearables and longevity subscriptions, carry the weakest evidence for functional outcomes, and the things with the strongest evidence — walking, sleeping, lifting something heavy twice a week — are free. If reading this makes you spend money, I've failed at it.
Third, and hardest to dismiss: the gap is structural, not personal. A Lancet Public Health study across 16 EEA countries and the four UK nations found European life-expectancy improvements slowing from around 2011, before COVID had anything to do with it. And the income gradient is ugly: in the EU, 35.3% of the poorest quintile report an activity limitation against 18.1% of the richest. England is worse: in 2022 to 2024, healthy life expectancy at birth was 49.8 years for men in the most deprived decile against 69.2 in the least, a twenty-year gap in good years against a ten-year gap in years alive.
Most of that gradient was built over decades by work, housing, education and air, not by a line item added at 35. So framing all this as a personal budgeting decision is individualising a structural failure, which is the move this genre makes constantly and which I complain about when other people do it. I'd rather say that than pretend a budget line beats a postcode.
Two smaller ones. The measurement is soft: health-adjusted life expectancy leans on survey-derived disability weights, and Eurostat's Healthy Life Years on a self-reported question, which is why Bulgaria appears to report 11.3 healthy years out of 16.8 and why nobody should build anything on that number. And it is all population data, averaging people who die suddenly at 82 in good health with people who spend 25 years with a chronic condition. It gives you the shape of a population, not your own number.
And since I promised not to cherry-pick: the evidence that retiring earlier buys healthy years is mixed. Reviews find mental health tends to improve at retirement, cognitive skills tend to deteriorate, and mortality is roughly unaffected. Losing structure, purpose and the people you saw every week is itself a healthspan risk, which is the best argument I know for a classroom rather than a beach.
The twenty-minute audit, and the healthspan vs lifespan line I put on our money date
None of this needs a country, a tax wrapper or an insurance system, so here are four things that work identically in Austin, Amsterdam and Brno.
Mark the usable years in your own projection. Take the age your plan runs to, then write next to it how many of those years the population data expects to be healthy ones. At 65 in the EU: 20 years left, 9.4 healthy. It changes nothing in the arithmetic and everything in how you read the output. Five minutes, and it is the highest-leverage thing here.
Name exactly one health line that is never cut. Not a wellness category. One line, one amount, with the same protected status as the rent. The point isn't the euros, it's taking that line out of the set of things that lose the monthly argument.
Put the time in the calendar the way the transfer is automated. My monthly ETF purchase works because nobody re-decides it. Health time fails because it gets re-decided every evening at six, by a tired person, against a sofa. WHO's target is 150 to 300 minutes of moderate activity a week plus something muscle-strengthening on two days.
Take it to the money date. Ours is ten minutes with a coffee and a bank statement. A household that agrees a line is protected will protect it. One person privately intending to move more will not, and I say that with no confidence in myself whatsoever.
One more that belongs to the plan rather than the body. David Blanchett's 2026 work found the median retiree traces a declining real spending path with no late-life uptick, and that affluent retirees cut too, which points at capability rather than money running out. Put that next to the activity-limitation curve and it's the same curve from two sides. Retirees aren't becoming frugal. They're becoming unable. That turns die with zero from a permission argument into a timing one: move the spending forward, because that's when the body is there to receive it.
What finally landed for me is that my plan's terminal state was never "have money." It's "be a person who can stand in a classroom for six hours and still have a voice at the end." That's a specification, not a virtue. Specifications get funded. Virtues get deferred.
We added a line at the last money date and put a block in the calendar. Two weeks in, I have absolutely nothing to report, which is exactly why I'm writing this now rather than in five years, when I'd have a tidier story and no way for you to tell whether it survived contact with a tired Tuesday.
The plan still runs to 90. It just has a note on it now.
Stay updated
Get notified when we publish new articles.
Ready to apply this?
Start tracking your finances today and put these tips into practice.
- Import bank statements in seconds
- AI-powered categorization
- Beautiful visualizations
- Set and track financial goals
Related posts
How Long Will Your Savings Last in Retirement? (Table)
At 4% a year and a 3% real return, savings last about 44 years; at 6%, about 22. Two bad years at the start can cut a 37.4-year plan to 21.5.

One More Year Syndrome Starts the First Time You Raise Your FIRE Number
Our daughter is the first thing in five years I'd accept as a reason to change our FIRE number. One more year syndrome doesn't wait for the finish line: it starts the first time a good market year talks you into a bigger target. Market moves the date. Life moves the number.

Retire Early Abroad: Why the Cheap-Country Discount Shrinks
Moving somewhere cheaper does cut your FIRE number, by less than advertised and not for good. A view from Czechia, one of the countries on those lists.