The Investor Return Gap: Your Fund Made 9.9%, You Made 8.7%
 Dennis Vymer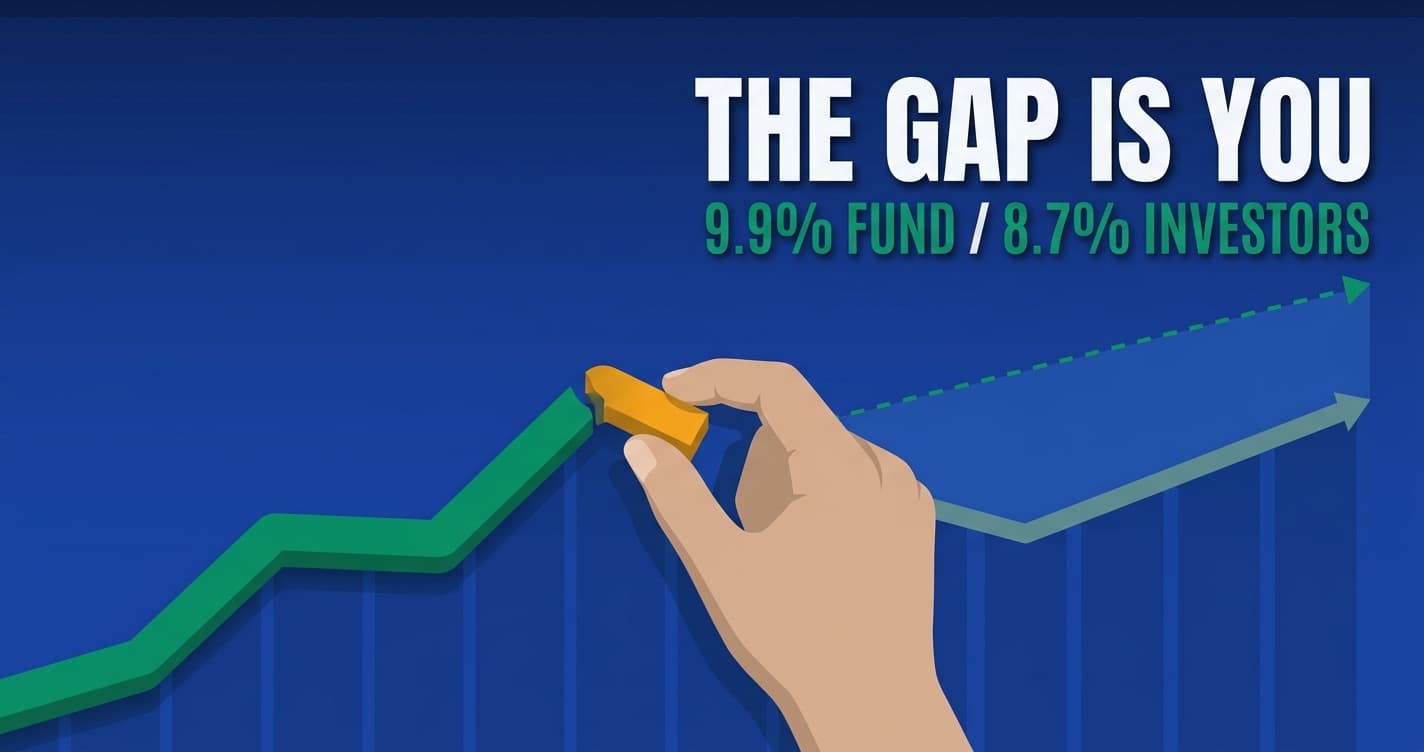
The most expensive thing I ever bought was a story about myself.
A few years back a stock I picked went up, and I decided that was skill rather than weather. So I moved the winnings into crypto, well after the chart had done the interesting part, and spent months checking a price at traffic lights. Then it fell and I sold, because a red number in your own account feels nothing like one in a backtest. I called it risk management. It was flinching.
That has a name. It's called the investor return gap, and Morningstar has been measuring it for years.
The 2026 edition landed a week ago. Over the ten years ended 31 December 2025, the average dollar invested in US funds and ETFs earned 8.7% a year. The funds those dollars were parked in earned 9.9% a year.
Same funds. Same decade. 1.2 percentage points that quietly disappeared somewhere between the product and the person.
I was that 1.2 for a while. This is about why, and about the thing that eventually fixed it for me, which was not, I'm sorry to report, becoming a more disciplined human being.
The study that reads like my old account statements
Morningstar publishes Mind the Gap every year. It's a very boring piece of accounting with a very rude punchline. They take roughly 23,000 US funds and ETFs, work out what the funds returned, then work out what the money inside them returned once you account for when that money showed up. The second number is almost always smaller. For the decade to the end of 2025, the shortfall was worth about 12% of everything the funds produced. Morningstar puts the aggregate arithmetic somewhere around $3.8 trillion.
One correction before anybody quotes me badly, because Morningstar's own summary bullet contains a typo that half the trade press copied last week. That 8.7% is all US mutual funds and ETFs together, bonds and alternatives included. US stock funds specifically did far better on both sides of the ledger: 12.8% for investors against 13.3% for the funds. If you see a headline saying US stock funds earned 8.7%, that's the typo travelling.
And yes, this is US data. I'm writing from Europe and I don't own a single fund in that dataset. But nothing in the conclusion touches a US account type or a US tax rule, because the behaviour being measured doesn't carry a passport. Somebody in Amsterdam buying a UCITS world ETF and somebody in Austin buying a total-market fund manufacture this gap at the identical two moments: they add extra after a good run, and they go quiet during a bad one.
What the investor return gap actually measures
The return your fund advertises is time-weighted. It assumes one lump of money went in on day one, sat there through everything, and came out at the end. Nobody on earth invests like that. Your actual result is money-weighted, an internal rate of return if you want the proper name for it. It cares how much of your money was present for each stretch of the ride. If you had 5,000 invested through the flat years and 50,000 through the ugly ones, your number looks nothing like the fund's published number, and not one manager did anything wrong.
Picture two people and one world ETF over the same ten years. Anna sends the same amount on the same day every month and never opens the app. Ben starts the same way, pauses his transfer for eight months after a quarter that scares him, then drops a fat lump in after a year that made the news. One fund, one decade, two different results, and the only variable is when the money was in the room.
That's the whole idea, and notice what it isn't: not fees, not stock picking, just presence.
Here's the part that keeps me honest, and I'll come back to it: Morningstar says plainly that even good habits open a gap. Investing a slice of every paycheck opens one. Rebalancing on schedule opens one. Which is why the statistic is so easy to misread, and why there's now a peer-reviewed paper arguing that most of the people quoting it have.
I already fought out the entry-method version of this in lump sum versus dollar-cost averaging, and the short version is that how you get in matters far less than whether you keep pressing the button at all.
The crypto section is a mirror, and I don't enjoy looking at it
New in the 2026 edition is a case study on the spot bitcoin ETFs that existed on 11 January 2024. From launch through 30 June 2026, those ETFs returned +8.5% a year in aggregate. The average dollar inside them returned −5.8% a year.
The fund made money. Its investors lost money. Same product, same window, opposite sign.
 Data: Morningstar, Mind the Gap 2026.
Morningstar's description of how that happened is almost clinical. The biggest inflows arrived after bitcoin had already streaked higher, first in early 2024 and again in the first half of 2025, and then came the redemptions during the later downturn, "effectively locking-in losses". Much of the damage traces to people piling into one ETF after the rally had already happened.
Go back and read the second paragraph of this article. Same shape. I just did mine years earlier, before there was a neat ETF wrapper for it, so my version doesn't show up in anyone's exhibit.
The same report has a 2x long Coinbase ETF that returned 47.6% a year over three years while the average dollar inside it lost more than 38% a year. Maximum effort, negative reward. The delivery mechanism is always a story, and stories arrive on a screen now. I wrote about that pipeline in FinTok versus real wealth. This dataset is the receipt.
Picking the right fund doesn't save you. Picking a calm one might.
This is the finding I'd tattoo on the inside of my eyelids if I were the tattoo type.
Sort every fund in the study by cost and the gap barely twitches. The cheapest fifth of funds gave up 1.0 point a year; the priciest fifth gave up 1.2. Sort the same funds by volatility instead and the thing detonates. The calmest fifth: investors got 11.2% against the funds' 11.6%, a gap of 0.4 points. The wildest fifth: investors got 5.8% against the funds' 8.0%, a gap of 2.2 points.
 Data: Morningstar, Mind the Gap 2026.
A fivefold difference across volatility. A rounding error across fees. Morningstar's own phrasing is that more-volatile funds "push investors' buttons", and the button is the price.
Now the part index investors like me don't enjoy. Index funds gave up 1.1 points a year and active funds gave up 1.6, and Morningstar concludes there's "no strong evidence of a link" between management style and timing gaps. Worse: ETFs had a wider gap than old-fashioned mutual funds, 1.6 points against 1.2, because ETFs are easy to trade and easy to trade is the entire problem. The vehicle doesn't defend you. It gives you a faster sell button.
Meanwhile the largest category by assets, large blend, the most forgettable thing an ordinary person can own, produced an investor return of 14.0% against a fund return of 14.0%. Zero gap. The best-behaved investors in America were holding the most boring fund in America, and I don't think that's a coincidence. Boring is load-bearing, which is roughly the argument I made in the best world ETFs.
The only investors who beat their own funds did it by accident
Buried in this year's report is one group whose money-weighted returns came in above their funds' own returns. Not level. Above. Buffer ETF buyers, over both the three and five years to the end of 2025, by roughly 0.2 and 2.0 points respectively, according to WealthManagement's write-up of the exhibit.
Were they smarter? No. Their product has a defined outcome period, so the flows cluster into the month that period opens and closes. Morningstar's explanation is that this made the pattern of demand "more akin to buy and hold". Jeff Ptak, who wrote the study, called it a success story of investors "using those in the way they are intended to be used, which is to invest at the beginning of the investing period and hold it to the end".
Translate that out of research-speak and you get the thesis of this article. Those investors didn't resist the urge to fiddle. The product's calendar didn't give them many days on which fiddling was possible.
If that sounds like a niche American finding, the cleanest natural experiment on the planet is British. Before automatic enrolment in 2012, around 55% of eligible UK employees paid into a workplace pension. By 2024 it was 88%, with 21.7 million eligible employees actively paying in (IFS, IPE).
Nobody in Britain became more disciplined between 2012 and 2024. The default flipped from opt-in to opt-out, and thirty-something points of behaviour moved with it.
So here's my position, and it's the opposite of what almost every write-up of this study will tell you this month. The advice is not "be more disciplined". Discipline is a resource you spend — it runs out on exactly the days you need it most, and no adult I know has a surplus at 22:40 on a Tuesday with the market down 9%. The fix is fewer opportunities to decide.
The counter-argument I have to print, because it might be right
Now the bit most articles about this study will skip, and it's the reason I sat on this piece for a couple of days.
In May 2026, four academics published a paper in the Financial Analysts Journal with a title that isn't subtle: "Bad Timing Does Not Cost Investors 15% of Their Funds' Returns." Fulkerson, Jordan, Riley and Yan re-ran Morningstar's own sample and concluded that poor timing by fund investors costs them 0.10% a year, not 1.2% (abstract).
Their argument is mechanical rather than philosophical. Morningstar weights cash flows using end-of-month values, which in a rising market overweights the funds that did best and inflates the benchmark. It also uses monthly rather than daily data, ignoring everything inside a month. Fix both and most of the gap evaporates. The authors say they showed their work to Morningstar and got no objection to their description of the calculations.
Then there's the objection you can derive on a napkin: for the market as a whole there can't be a gap, because every buyer has a seller and one person's shortfall is another's surplus. Morningstar says so itself, in the report, out loud.
Morningstar's own introduction is more careful than any coverage I read last week. It says it is "not advisable to view this study's findings as a parable of 'dumb money'", and that timing effects shouldn't "be interpreted as literal opportunity costs": someone who bought after a fund had already risen hasn't lost the earlier gains, their dollars just earn whatever comes next. The people who calculated the number are visibly less confident about it than the people quoting it.
While I'm correcting the coverage: the gap is not growing. One write-up this week was literally headlined that it keeps growing. The rolling ten-year gaps run 1.7, 1.7, 1.1, 1.2, 1.2 points for the periods ending 2021 through 2025. Flat against last year, narrower than 2021 and 2022. Quote a study, quote its trend line.
So treat 1.2 points as an upper bound and 0.10 as a lower bound. Here's why every practical instruction below survives either way.
 Data: return rates from Morningstar, Mind the Gap 2026, and the Financial Analysts Journal, 2026. The 30-year balances are an illustration, not a forecast.
That chart is an illustration and not a forecast: 500 a month for thirty years, contributions at month end, no fees, no tax, no inflation, so the only thing separating the lines is the gap itself. At the headline 1.2 points it costs about 208,000 over thirty years. At the academically corrected 0.10 points it still costs about 19,000. Nineteen thousand, for a habit that gives nothing back except something to do.
And averages are not what you live through. The cohort average hides the person who bought bitcoin exposure in the first half of 2025 and redeemed into the downturn. You don't experience the aggregate. You experience your own internal rate of return, and yours has a sample size of one.
Nobody's plan has ever improved by adding a discretionary trade. That statement doesn't need the number to be 1.2.
Four decisions make the investor return gap. Delete them, don't resist them.
Every removal here works the same in Austin and Amsterdam, which is more than most investing advice on the internet can manage.
One holding boring enough to ignore. The zero-gap category was the dullest one. The 1.6-point gap was in alternatives. Pick the thing you can leave alone for a decade, and treat "this is interesting" as a warning label rather than a selling point.
One automatic transfer on payday, so the purchase happens before the opinion does. In the 2022 edition of the same study, Morningstar modelled what would have happened if investors had simply made equal monthly investments instead. The mechanical version would have improved results in five of eight major category groups: about 0.76 points a year in international equity, more than 2 points in sector funds. Honest caveat, since I linked to it above. A standing order is not superior to investing a lump sum you already hold. It's superior to you deciding each month. Mine leaves the account the day after payday and buys one world ETF, and I have never once had to decide to let it happen.
One review date a year. A fixed cadence turns an endless stream of small decisions into a single scheduled one. Mine is in January, over coffee, with my wife, and it takes about an hour.
One screen you refuse to open. This is the volatility finding turned into a house rule. The price is the button. If you don't look at the price, nothing pushes the button. I've written the long version of this as what to do when markets crash, and the entire piece could be compressed to: close the app, go outside.
There's a fifth, and it's the couples version. Decide where a windfall goes before it lands, and agree the crash rule while nothing is crashing. The gap gets manufactured at exactly two moments, a windfall and a drawdown, and both are foreseeable even though neither is predictable. Money is a team sport, and the worst time to negotiate a rule with your partner is a red month.
One humbling footnote before anyone feels superior to the crowd. When the S&P 500 fell about 9% between late January and the end of March this year, only 17% of Vanguard's investors traded at all, and those who did were net buyers by nearly four to one (Vanguard). The mass panic finance media describes mostly isn't happening. The people quietly wrecking their returns are a minority. I was in it, and you can leave it without a personality transplant.
Boring isn't a personality. It's a structure.
Here's a twenty-minute job worth more than anything else in this article. Work out your own money-weighted return over a fixed window, then compare it against the published return of the fund you actually hold over that same window.
If the two are close, your system works and you can stop reading finance content for a while. If yours is materially lower, that difference isn't the market and it isn't the fund. It's you, and it's fixable with plumbing rather than willpower. If yours is materially higher, please don't conclude you're gifted. Morningstar has a leveraged Google ETF where the average investor beat the fund by nearly 24 points a year. That's not skill. That's what luck looks like when it gets printed in a table.
This is the whole reason I ended up building MFFT, which is obviously my own product, so weigh that as you like. The market's average is a trivia fact. Your own number is the one that pays for your life.
Then put your attention somewhere it actually compounds. Over a decade your savings rate and your earning power move the finish line further than any decision you'll ever make about returns, which I've argued with numbers in savings rate versus investment returns. The investor return gap is worth closing precisely because closing it is free and takes an afternoon, and then you never have to think about it again.
I'm not trying to be the investor who beats his fund anymore. That guy showed up once, in a crypto position, and he cost me a genuinely useful amount of money and about a year of low-grade background anxiety. I'm trying to be the one who's still holding the whole 9.9% at 40, on a Wednesday I didn't have to spend earning it.
Turns out that guy doesn't need to be disciplined. He just needs a standing order and a locked screen.
Stay updated
Get notified when we publish new articles.
Ready to apply this?
Start tracking your finances today and put these tips into practice.
- Import bank statements in seconds
- AI-powered categorization
- Beautiful visualizations
- Set and track financial goals
Related posts

Investing App Gamification Got Me Three Taps at a Time. The Fix Was Never More Willpower.
My worst trades took three taps and no research. I spent years blaming my own discipline before I checked what my broker actually earns in a year where I do nothing — and found out that no broker earns nothing, including mine. Here's the test I use instead of willpower.

When to Sell Your Investments: I've Never Pressed the Button, and That Isn't Discipline
I've bought one world ETF every month for years and never sold a share, and I called that discipline. It isn't. It's a question I never answered. Here's what our portfolio is allowed to buy, the shorter list of what it never is, and why I wrote it while the number was still boring.

AI Investing Advice Sells Conviction, Not an Edge. I Build a Money Tool and I Still Buy One Boring Fund.
Four in five young UK investors use AI for investing. Nearly three in four know it can be wrong. They do it anyway. AI didn't make anyone a better analyst, it made conviction free — and conviction was always the expensive part. Here's the test I use instead.