Do Stocks Always Go Up? The Truth That Will Surprise You
 Dennis Vymer
You've probably heard this:
"Stocks return an average of 10% per year."
Yes, that's true. And at the same time, it's very misleading.
Let's talk about what's really going on, without the complexity and investment fog.
10% Per Year? ...Only on Paper
Imagine a hospital.
The average temperature of all patients is 98.6°F. Great, right? Except one has a 107°F fever and the other is... dead.
The average checks out. Reality doesn't.
And that's exactly how stocks work.
Yes, US stocks (S&P 500) have returned roughly 10% annually over the last 100 years. But do you know how many times the yearly return actually landed between 8-12% — right around that average?
Fewer than 10 times in nearly 100 years (SoFi).
Most of the time, it looks like this:
| Year | Return |
|---|---|
| 1995 | +38% |
| 2008 | -37% |
| 2019 | +31% |
| 2022 | -18% |
S&P 500 total returns, dividends included (Slickcharts).
One year you're a king. The next year you want to sell everything.
This is normal.
The Longer You Hold, The Less Stress
Now here's the important part.
Look at how your chances of profit grow when you simply hold your investment:
| How Long You Hold | Chance of Profit |
|---|---|
| 1 day | 53% (coin flip) |
| 1 year | 74% |
| 5 years | 88% |
| 10 years | 95% |
| 20 years | 100% |
Historical odds of a positive US-market return by holding period; Dimensional finds roughly three-in-four one-year periods positive, 95% of ten-year periods positive, and no period longer than about 15 years negative (Dimensional, "Embrace the Uncertainty").
Yes, you read that right.
Historically, there is not a single 20-year period where you would have lost money on the S&P 500.
Wars, crises, bubbles, COVID... All survived.
Time is stronger than any panic.
One Image That Says It All
Short-term: chaos
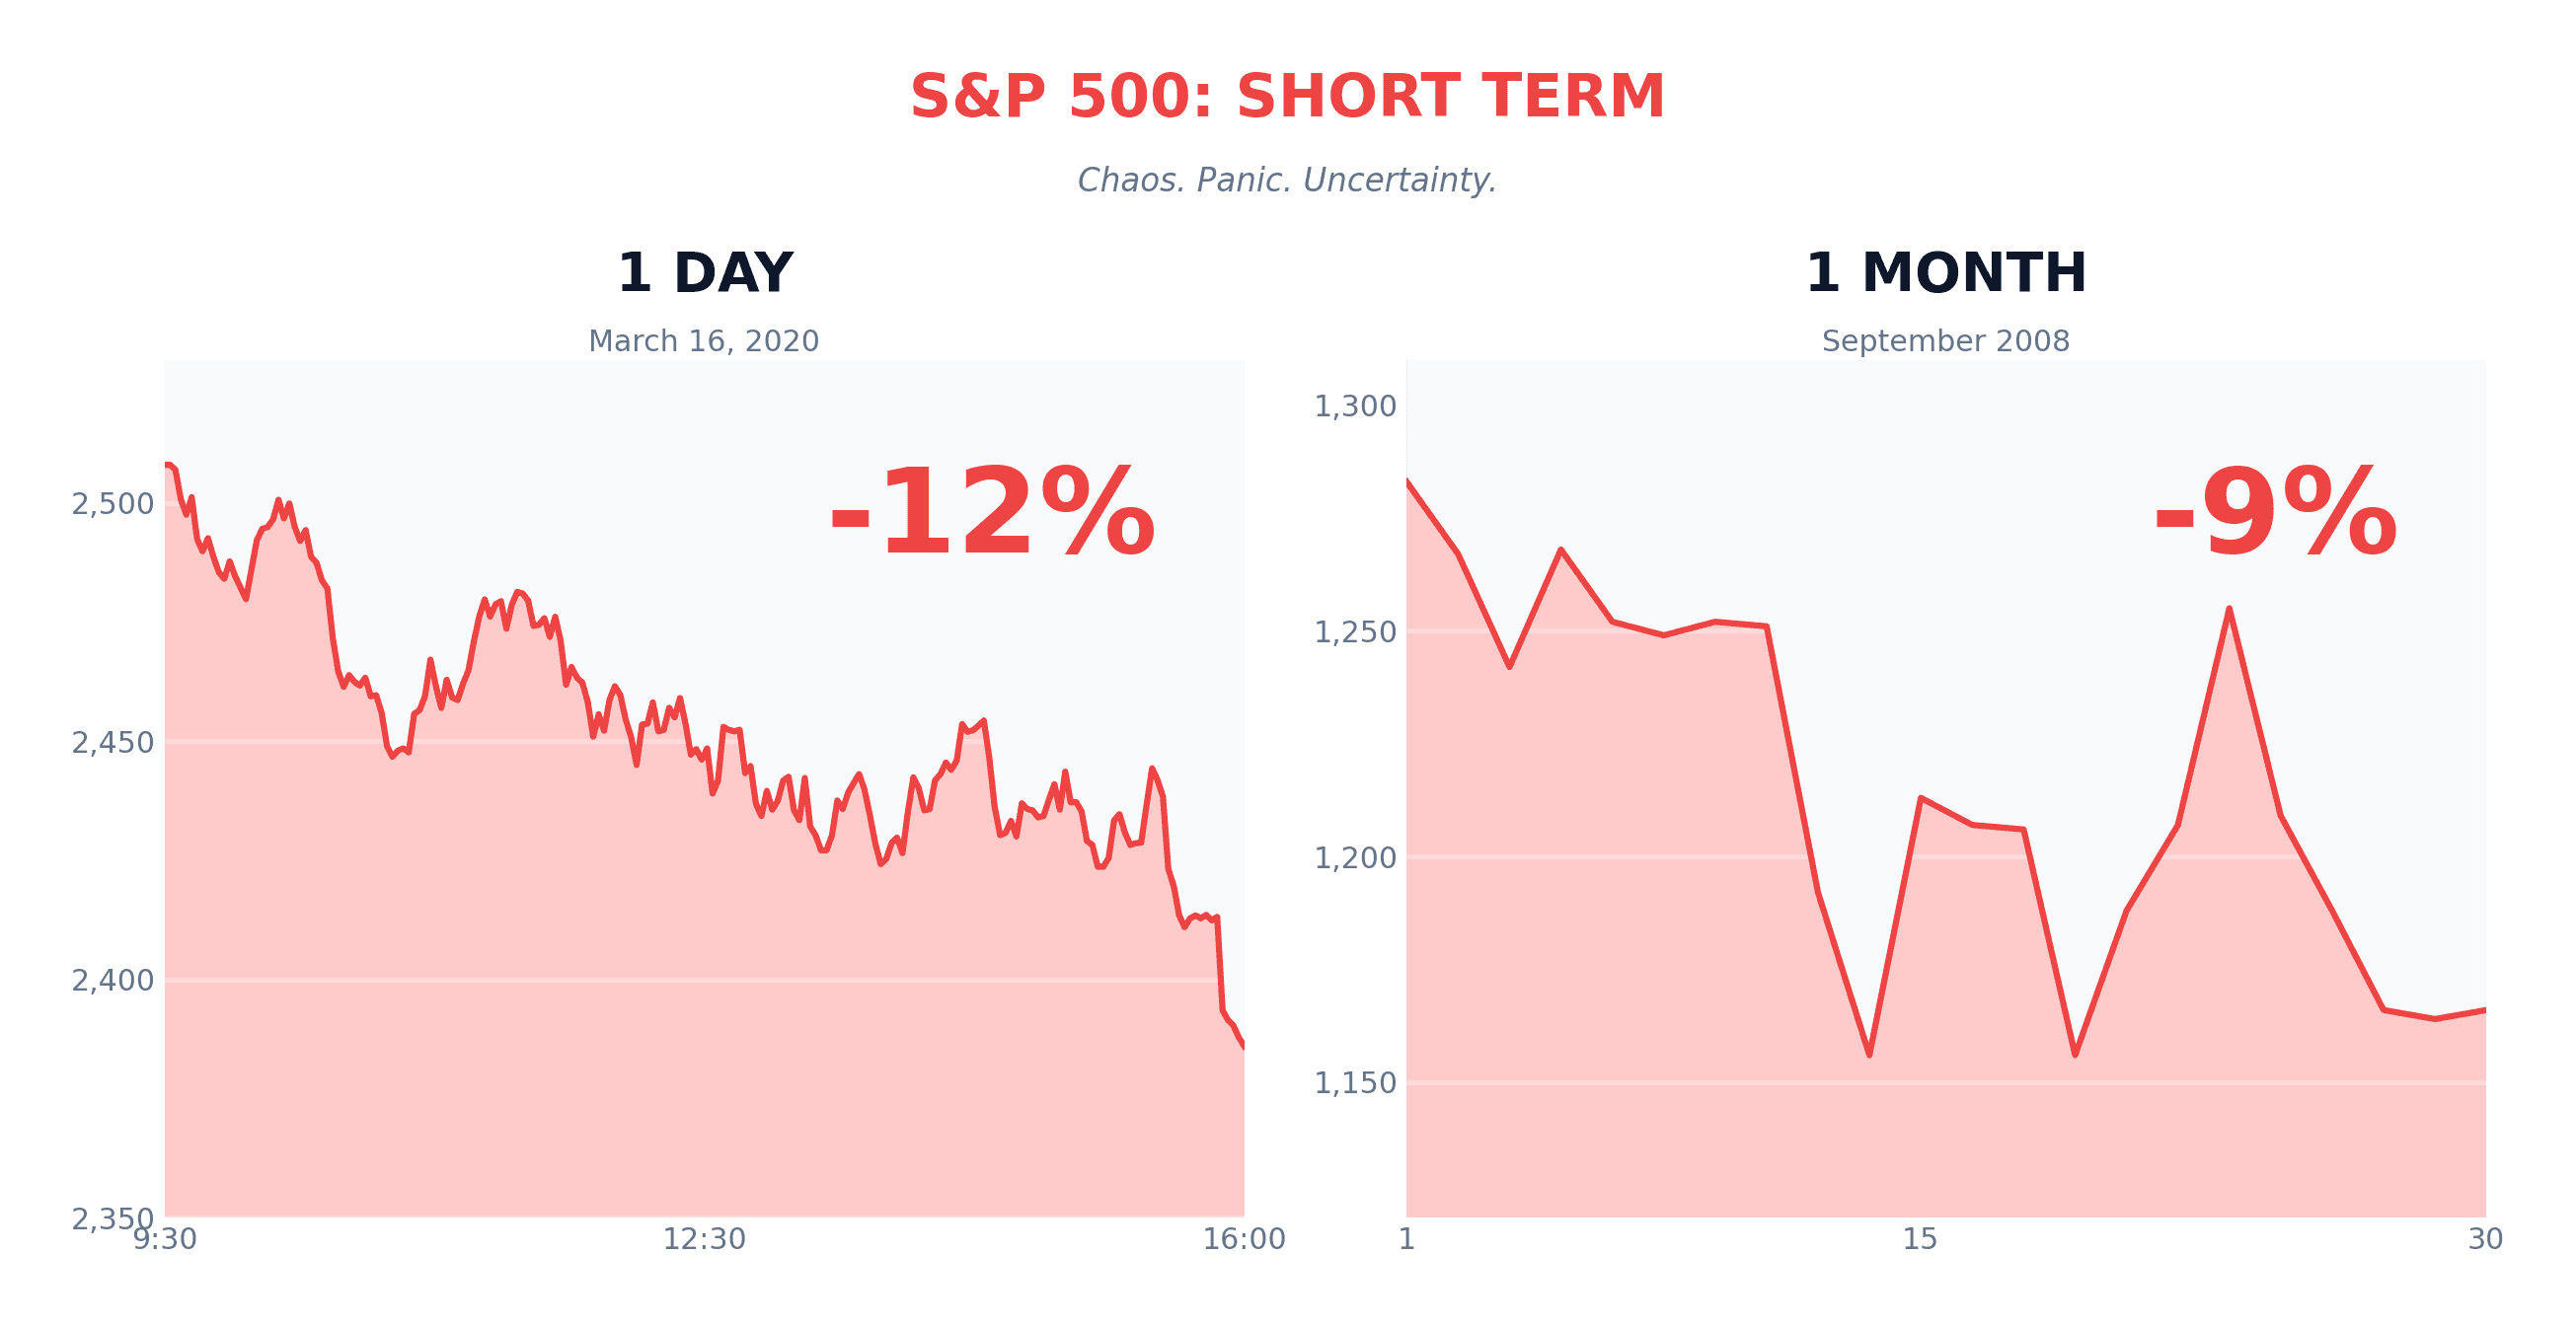
One day. One month. Red numbers, panic, uncertainty...
Long-term: growth
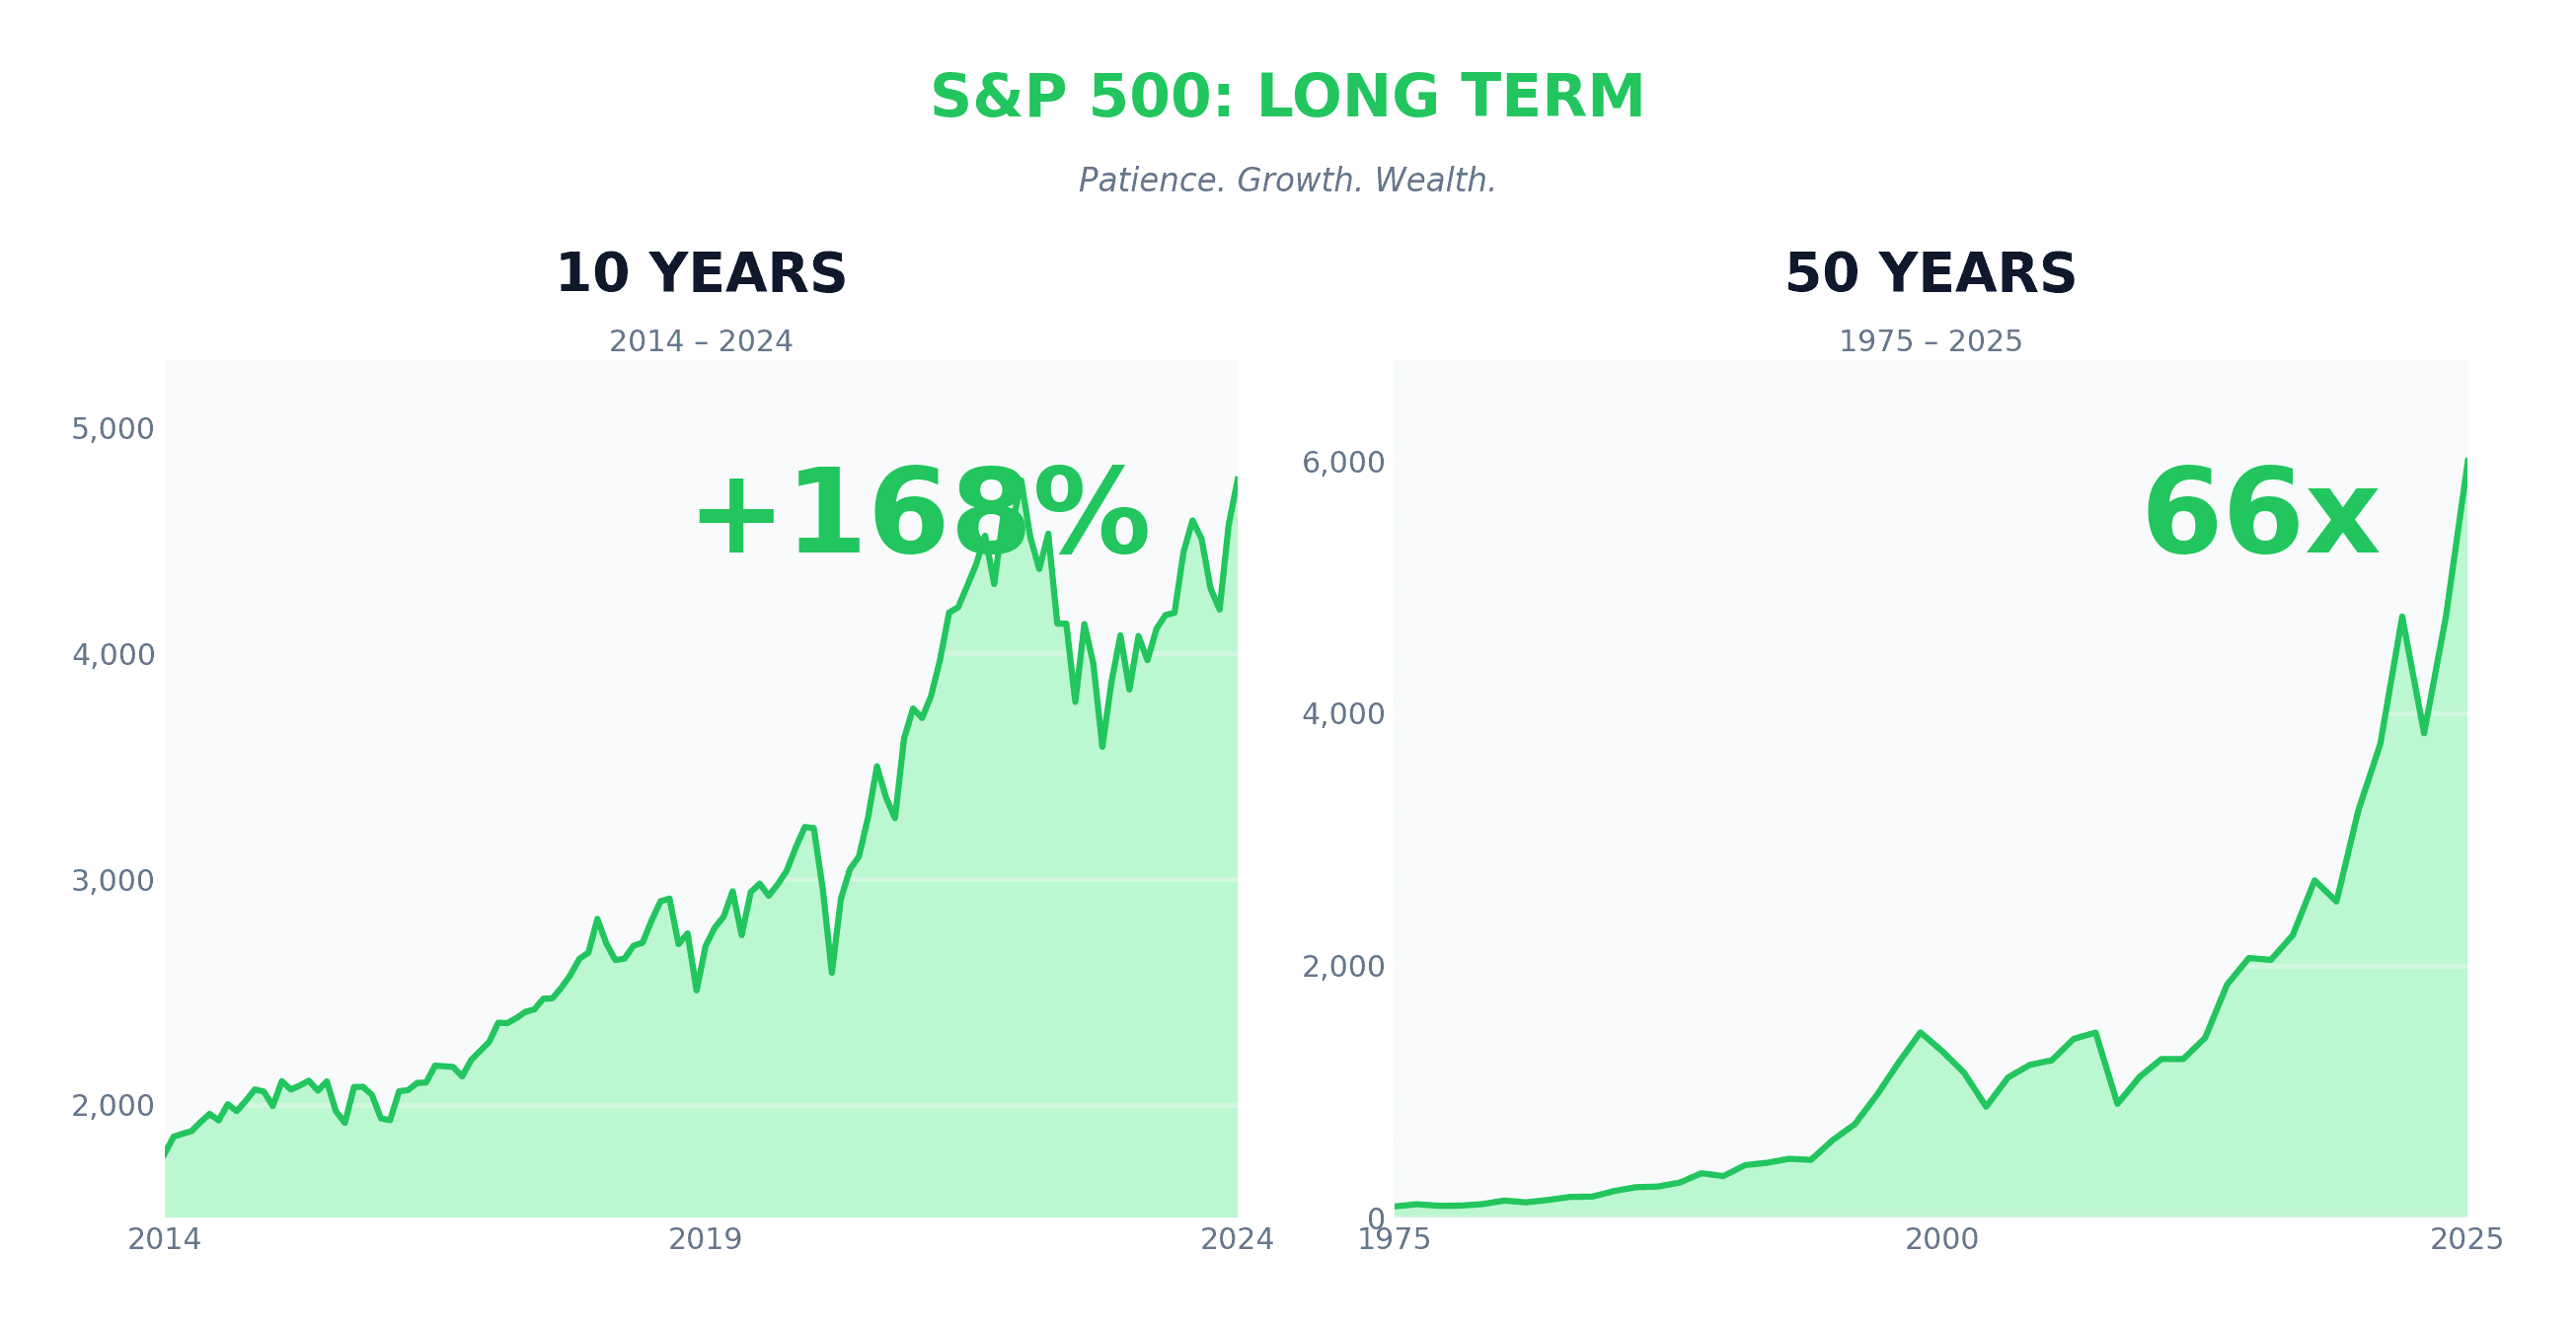
Ten years. Fifty years. Green numbers, patience, wealth. The more you "zoom out," the clearer you see: Long-term, the market grows.
As mentioned in other articles, those who are rewarded are the patient ones who can simply wait.
What If You Invest at the Worst Possible Moment?
Imagine you have really bad luck.
March 2000 - dot-com bubble
- You invest $10,000
- The dot-com bust drags the S&P 500 down about 49% over the next two years (S&P 500 drawdown history, DQYDJ)
- The 2008 crisis hits before you've fully recovered
Even from that cursed start, the market clawed back to new highs — and a lump left untouched has multiplied several times over since.
October 2007 - right before the financial crisis
- You invest $10,000
- The 2007-09 crash cuts the S&P 500 roughly 57% (DQYDJ)
- It takes about 5.5 years to reach a new high
Hold through it and that $10,000 ends up worth far more than you started with.
February 2020 - right before COVID
- You invest $10,000
- COVID drops the market about 34% in a few weeks (Wikipedia)
- It fully recovers in roughly 5-6 months
Even the fastest crash in modern history was made back inside a year.
Even the unluckiest investor eventually made money. All it took was not panicking.
Want to try your own worst-case date? What If I Invested replays a purchase from any month against real historical prices, so you can pick the crash you remember and see where that money sits today.
The Biggest Mistake: Selling at the Bottom
All the recoveries above only reward the people who held. Sell at the bottom and you swap a paper loss for a permanent one — then you have to decide when to buy back, usually higher.
This isn't hypothetical. Morningstar measures the gap every year: the average fund investor earned about 8.7% a year while the funds themselves earned 9.9% — the cost of buying and selling at the wrong moments, repeated across millions of accounts.
Once you sell, the loss is permanent.
That's why, at the depths of the 2008 crash, Warren Buffett wrote in The New York Times that his rule was simple:
"Be fearful when others are greedy, and be greedy when others are fearful."
— Warren Buffett, "Buy American. I Am.", The New York Times, October 2008 (full op-ed text)
Until you sell, you haven't locked in a loss.
Invest All at Once, or Gradually?
The data tells us clearly: investing all at once has beaten spreading it out over 12 months in roughly 68% of historical periods (Vanguard's cost-averaging research).
But...
Regular investing has one big advantage: peace of mind.
What works best?
- You have nerves of steel -> invest immediately
- You're scared -> spread it over several months
- You don't have savings -> invest regularly from your paycheck
The best strategy is the one you can actually stick to.
What to Remember
1. Stocks don't always go up. Drops are normal. 2. Long-term, they do grow. Historically, always. 3. Time is your greatest ally. 4. The worst thing is panic and selling. 5. The best move is to start and stay the course.
If you have questions, email me at dennis.vymer@myfinancialfreedomtracker.com.
Stay updated
Get notified when we publish new articles.
Ready to apply this?
Start tracking your finances today and put these tips into practice.
- Import bank statements in seconds
- AI-powered categorization
- Beautiful visualizations
- Set and track financial goals
Related posts

When to Sell Your Investments: I've Never Pressed the Button, and That Isn't Discipline
I've bought one world ETF every month for years and never sold a share, and I called that discipline. It isn't. It's a question I never answered. Here's what our portfolio is allowed to buy, the shorter list of what it never is, and why I wrote it while the number was still boring.

AI Investing Advice Sells Conviction, Not an Edge. I Build a Money Tool and I Still Buy One Boring Fund.
Four in five young UK investors use AI for investing. Nearly three in four know it can be wrong. They do it anyway. AI didn't make anyone a better analyst, it made conviction free — and conviction was always the expensive part. Here's the test I use instead.
Investing at All-Time Highs: I Bought Again This Month. The Number I Changed Was in My Plan, Not My Standing Order.
I bought my usual world ETF at a Shiller CAPE of 41, a level the market has only ever hit in 1999 and 2000. I still didn't touch the standing order. Valuation explains 25.8% of the next decade and 3.9% of the next year, so it belongs in your plan, not your bank instruction.