Dividend vs Growth Stocks: Same Return, Different Tax Bill
 Dennis Vymer
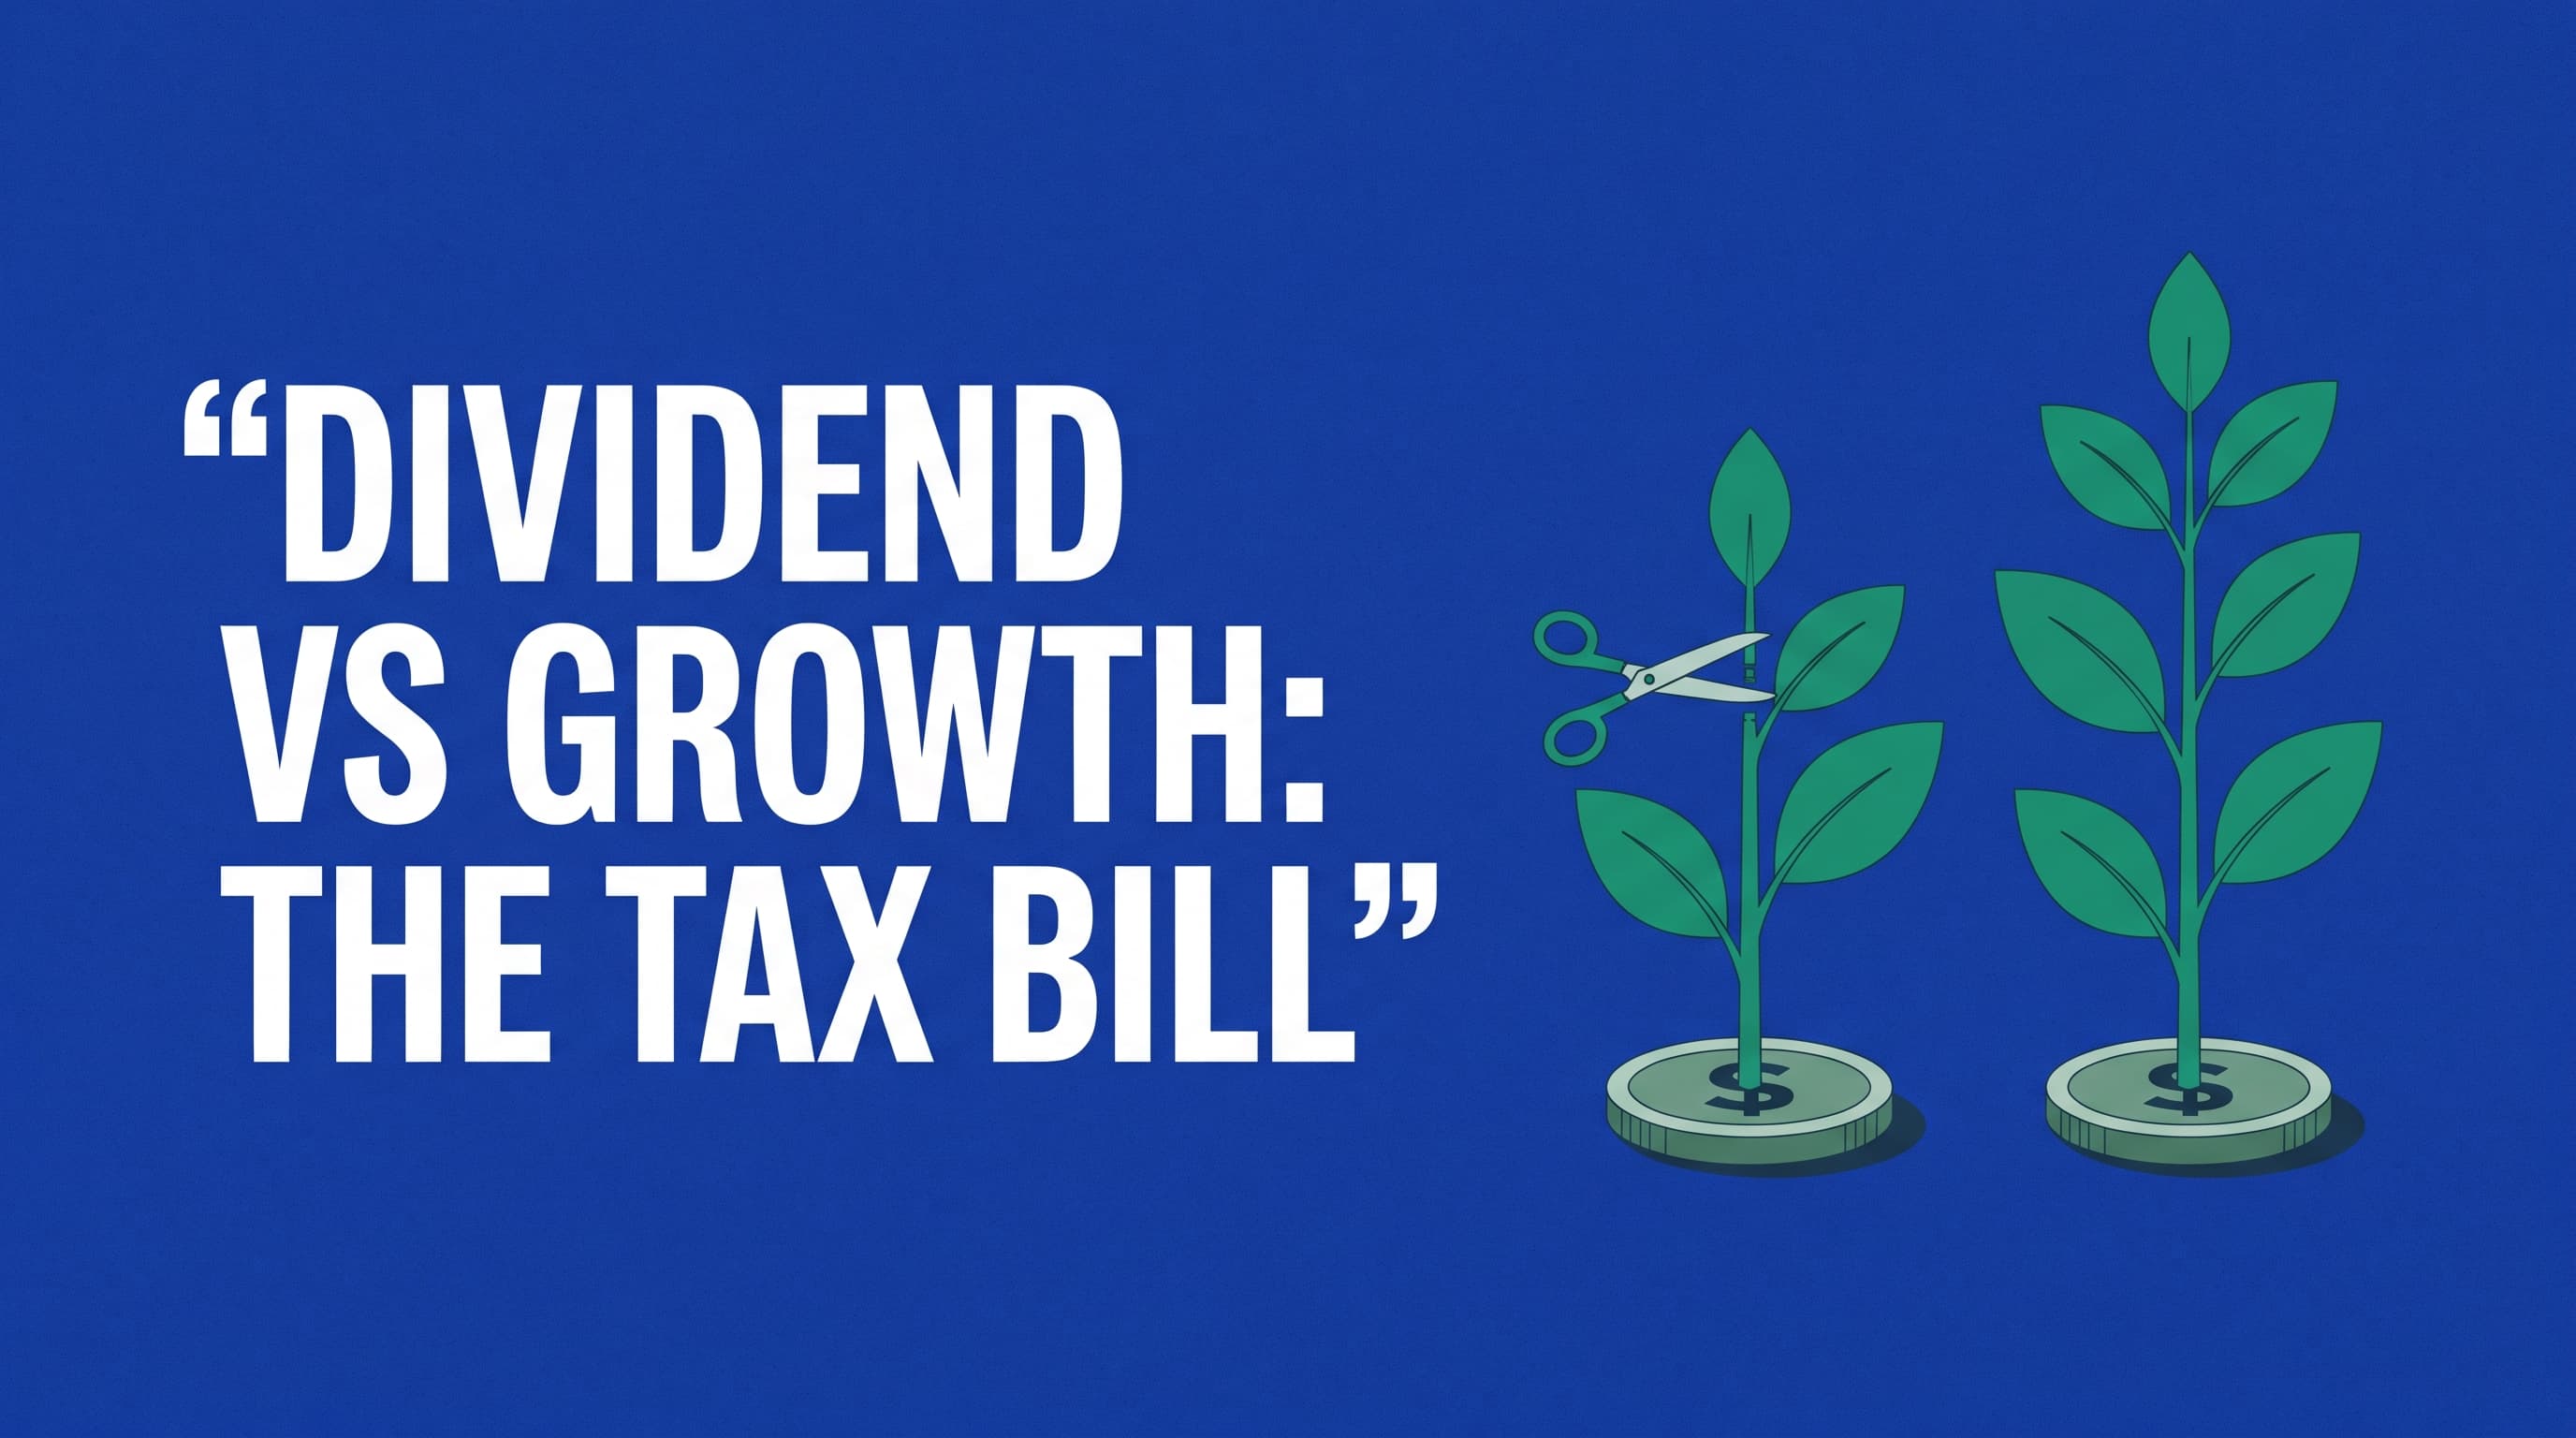
A dividend is part of total return: the share price drops by the amount paid out. At the same 8% total return, a 4%-yield portfolio taxed at 15% a year ends about 13% smaller after 25 years than a fund that pays nothing out, because the tax cuts its compound growth to 7.4%. For building wealth, growth or an accumulating fund usually wins; dividends suit people who need the cash now.
Growth shares get taxed too, later, when you sell; counting that, the gap on the same model drops to about 7%. It disappears completely inside a tax-free wrapper, or in the handful of European countries with a 0% dividend tax. Over the ten years to September 2026 the MSCI World Growth index returned 15.14% a year against 8.56% for MSCI World High Dividend Yield, with more volatility along the way (a 10-year standard deviation of 17.00% against 12.81%) (MSCI growth factsheet, MSCI high dividend factsheet).
Which one fits your situation
| Your situation | Better fit | Why |
|---|---|---|
| Building wealth in a taxable account, 10+ years to go | Growth or an accumulating fund | No yearly tax on payouts, so more money keeps compounding |
| Investing inside a tax-free wrapper | Either; pick on diversification and cost | No yearly dividend tax, so the after-tax gap closes |
| Retired and spending from the portfolio | Dividends or selling shares both work | Same total return; dividends are automatic, selling is more flexible |
| Know you'd panic-sell in a crash | Dividend payers can help | Investors are measurably less likely to sell them |
| Country taxes dividends at 0% | Either | Estonia, Latvia and Malta, per the Tax Foundation |
How the two kinds of company differ
A dividend stock pays out a big slice of its profit in cash every year. Two numbers describe it: the payout ratio (the share of earnings paid out) and the dividend yield (the yearly dividend divided by the share price). A growth stock keeps most of its profit and reinvests it in the business, so the return has to show up in the share price.
| High dividend | Growth | Whole market | |
|---|---|---|---|
| Index | MSCI World High Dividend Yield | MSCI World Growth | MSCI World |
| Dividend yield | 3.19% | 0.70% | 1.52% |
| P/E ratio | 16.82 | 29.66 | 22.69 |
| 10-year volatility (std dev) | 12.81% | 17.00% | 14.88% |
| 10-year return, per year | 8.56% | 15.14% | 12.81% |
| 2022 | -4.74% | -29.21% | -18.14% |
| Example ETF | SCHD: 0.06% cost, 3.18% 30-day SEC yield | VUG: 0.03% cost, 0.39% trailing yield | VWCE: 0.14% OCF, pays nothing out |
Index data as of 30 September 2026, USD net, from the MSCI World High Dividend Yield and MSCI World Growth factsheets. Fund data from Schwab (yield as of 20 October 2026), the Vanguard VUG factsheet with the yield from ETF Central, and Vanguard's VWCE page.
A dividend comes out of the share price
Total return is the dividend yield plus the price change, and a payout is cash leaving the company. With a significant dividend, the price of a stock may fall by that amount on the ex-dividend date (Investor.gov). Merton Miller and Franco Modigliani showed back in 1961 that, given a company's investment plans, its dividend policy doesn't change what the company is worth, except through information and taxes (Chicago Booth Review).
Receiving 4% of your portfolio as a dividend and selling 4% of your shares leave you in the same place economically, apart from costs, timing and tax. The dividend arrives on the company's schedule and gets taxed even if you didn't want the cash.
Hartzmark and Solomon call the habit of treating them as different money the "free dividends fallacy". In their data, investors are less likely to sell high-dividend stocks, and demand for dividends rises when interest rates are low and after bad markets. Chasing those crowded names left total returns 2 to 4 percentage points lower over the following year (CFA Institute digest of "The Dividend Disconnect").
Hartford Funds puts the contribution of dividends at 33% of the S&P 500's total return from 1940 to 2025, but only 12% so far in the 2020s (Hartford Funds, The Power of Dividends). Under Miller and Modigliani's logic, cash a company kept and reinvested well would have shown up in the share price instead.
Same 8% return, 25 years: what taxes do
Start with 10,000 (euros, dollars, any currency), hold for 25 years, and give all three portfolios exactly the same 8% total return a year, with no costs and no new contributions. Dividends are taxed every year and the rest is reinvested.
- A: 4% dividend yield + 4% price growth (a high-dividend portfolio)
- B: 1% yield + 7% price growth (a growth portfolio)
- C: an accumulating fund, 0% paid out + 8% growth
Each year the value grows as V × (1 + growth + yield × (1 − tax)). At a 15% dividend tax, portfolio A really compounds at 7.4% a year instead of 8%, and B at 7.85%.
| Dividend tax | A held | B held | C held | A after selling | B after selling | C after selling |
|---|---|---|---|---|---|---|
| 0% | 68,485 | 68,485 | 68,485 | 68,485 | 68,485 | 68,485 |
| 15% | 59,581 (−13.0%) | 66,146 (−3.4%) | 68,485 | 55,561 (−7.0%) | 58,636 (−1.8%) | 59,712 |
| 25% | 54,274 (−20.7%) | 64,630 (−5.6%) | 68,485 | 47,949 (−11.0%) | 52,294 (−2.9%) | 53,864 |
"Held" is what you have if you never sell; "after selling" sells everything in year 25 and pays capital gains tax at the same rate as the dividend tax on the unrealised gain; percentages compare with C in the same column group.
 Data: MFFT model in this article: 10,000 start, 25 years, 8% total return for all three portfolios (A 4% yield + 4% growth, B 1% + 7%, C accumulating 0% + 8%), 15% dividend tax paid yearly, net dividends reinvested, no costs, values held (not sold).
At 0% tax all three end at 68,485. At 15% the high-dividend portfolio paid 4,020 in dividend tax along the way, and the money that tax would have earned is gone too, so the gap widens every year. Selling everything in year 25 narrows the gap to 7% at a 15% rate and 11% at 25%, which is what postponing the tax on growth shares is worth. To put your own horizon on it, type the same starting amount into the free compound interest calculator at 7.4% and again at 8%, and compare the two end values.
The Tax Foundation puts the average top personal dividend tax rate across 35 European countries at 20.82%, with the Czech Republic at 23%, Germany at 26.38% and France at 34% (Tax Foundation, 2026). Across most of Europe dividends are taxed in the year you receive them, which is the yearly drag the model applies. A European holding US shares also has 15% withheld at source under the treaty rate for the UK and EU countries such as Germany, France and the Czech Republic, and 30% without a treaty (IRS Tax Treaty Table 1). How that withholding counts against your local tax depends on your country.
What the index history shows
The MSCI factsheets show growth far ahead in 2020 (33.83% vs -0.03%) and 2023 (37.00% vs 9.12%), and high dividend far ahead in 2016 and 2022. Over their full histories both tilts end close to the market, with high dividend at 8.22% a year since 1995 against 8.41% for MSCI World and growth at 10.24% since 1974 against 10.53% (high dividend, growth).
 Data: calendar-year net returns in USD from the MSCI World Growth factsheet and the MSCI World High Dividend Yield factsheet, as of 30 Sep 2026.
Vanguard's own research argues that a high-dividend index is in practice a concentrated bet on mid-cap value stocks, and that a total-return approach keeps diversification, improves tax efficiency and leaves you in control of when you withdraw (Vanguard, Managing the low-yield environment).
European investors have a third option: accumulating UCITS share classes. VWCE, for example, reinvests every dividend inside the fund, so in countries that tax only when you sell, it compounds like portfolio C in the model. Some countries tax accumulating funds anyway, so check your own rules before counting on it.
When dividends are the better choice
You need the cash now. If you're spending from the portfolio, a dividend and a share sale both turn investments into money; the dividend just does it without a decision. The tax gap in the model builds up while you reinvest payouts for decades. For someone living on monthly dividends, the dividend snowball calculator projects that payout year by year from a fund's yield and dividend growth, before tax.
The money sits in a tax-free wrapper. With no dividend tax the three model portfolios end level, so cost and diversification decide.
You know you'd sell in a crash. The same behaviour Hartzmark and Solomon call a fallacy (people hold dividend payers longer) works as a guardrail for someone who would otherwise sell at the bottom, and the smaller fall in years like 2022 helps too.
You hold dividend growers rather than high yielders. Hartford's data shows S&P 500 companies that grew or started dividends returned 10.22% a year from 1973 to 2025, against 4.21% for non-payers, with a beta of 0.89 vs 1.18 (Hartford Funds). Non-payers include plenty of unprofitable firms, so the comparison overstates the case against growth stocks in general.
Check your own numbers
In the model, the gap grows with the dividend tax rate and with the number of years payouts are taxed and reinvested. For your own rate, take the yield of the fund you're considering, cut it by your dividend tax and add its price growth; at a 25% tax, a 4% yield with 4% price growth gives 7%. Run that rate against 8% in the compound interest calculator over the years you plan to hold.
Frequently asked questions
- Are dividend or growth stocks better for long-term investing?
- In a taxable account, growth stocks or an accumulating fund usually come out ahead, because dividends are taxed every year. With the same 8% total return, a 4%-yield portfolio taxed at 15% ends about 13% smaller after 25 years than an accumulating one, or about 7% smaller if you sell everything and pay capital gains tax. In a tax-free wrapper the difference disappears.
- Should I switch to dividend stocks in retirement?
- Only if automatic payouts suit you better than selling shares. Economically, a 4% dividend and selling 4% of your shares leave you in the same place, apart from tax and costs. Dividends spare you the decision of what to sell and when; selling gives you control over timing and often a smaller tax bill. Another route is to keep a broad fund and sell a set percentage each year.
- Is a dividend ETF better than a growth ETF?
- Over the ten years to September 2026, MSCI World Growth returned 15.14% a year against 8.56% for MSCI World High Dividend Yield, but growth fell much harder in 2022. Over their full histories both indexes land within about 0.3 percentage points of MSCI World, so a broad world ETF holding both is a reasonable default.
- What is the difference between dividend growth and high-yield investing?
- High-yield investing buys whatever pays the most today; dividend growth investing buys companies that keep raising their payout. Hartford Funds data shows S&P 500 companies that grew or started dividends returned 10.22% a year from 1973 to 2025, against 4.21% for non-payers. Non-payers include many unprofitable firms, though, and a very high yield can simply reflect a falling share price.
Stay updated
Get notified when we publish new articles.
Ready to apply this?
Start tracking your finances today and put these tips into practice.
- Import bank statements in seconds
- AI-powered categorization
- Beautiful visualizations
- Set and track financial goals
Free Financial Tools
Related posts
VOO vs QQQ vs SCHD: Overlap, Returns and Which to Own
VOO is the cheap core, QQQ a tech-heavy growth bet, SCHD a dividend-value tilt. Overlap, 10-year returns and drawdowns, and which one to own.
VT vs VTI vs VOO: Whole World, All US, or S&P 500?
VOO is the S&P 500, VTI all of the US, VT the whole world. The real choice is how much non-US stock you want. Here's what each one holds, by the numbers.
Private Markets for Retail Investors: Access Isn't an Edge
Private markets opened to retail investors in 2026. Read the launch like a product manager: who it was built for, the redemption gates, the smoothed NAV.