MSCI World vs MSCI ACWI: What the Extra 11% Buys You
 Dennis Vymer
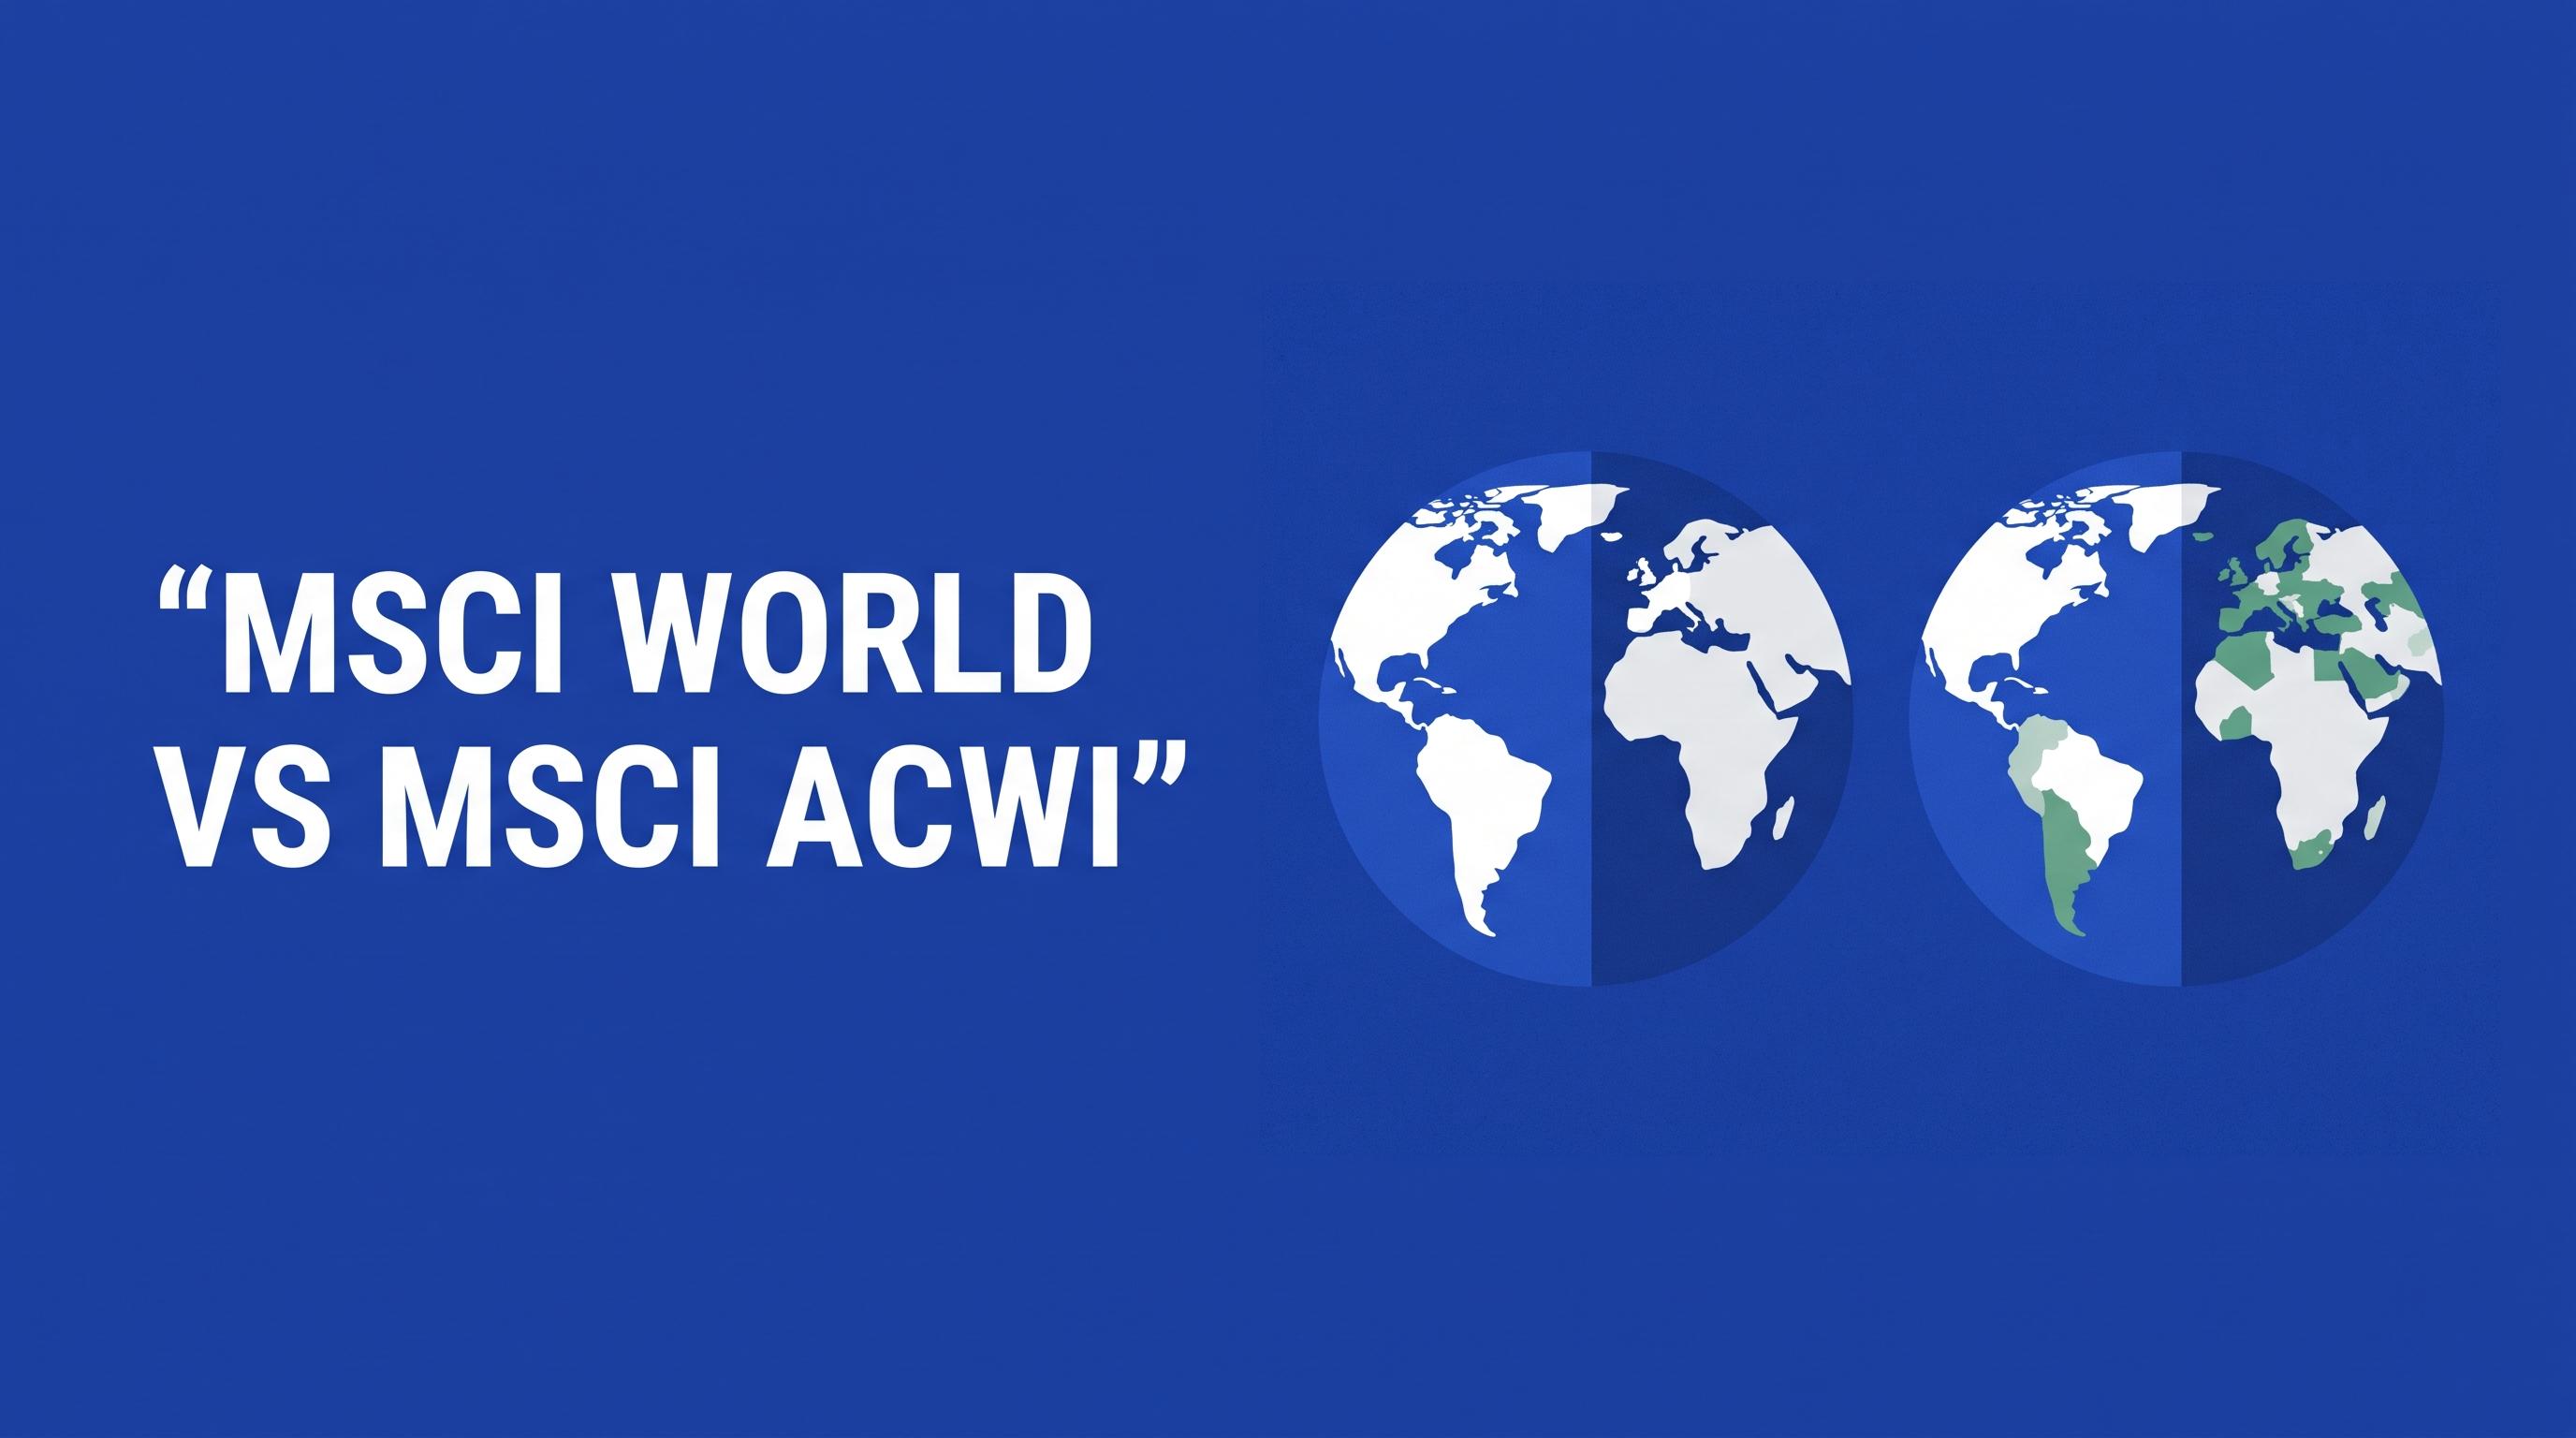
MSCI ACWI is MSCI World plus emerging markets: 47 countries instead of 23, with emerging markets about 11% and the US about 65% instead of 73%. The two indices are about 89% the same by weight; the card below reads the SEC filings of two ETFs that track them (URTH and ACWI), so its figure can differ slightly. Over 10 years World returned 12.95% a year, ACWI 12.39%. Pick ACWI or FTSE All-World for one whole-market fund, and MSCI World only if you'll add an emerging-markets fund or want developed markets only.
These figures come from MSCI's ACWI and World factsheets dated 30 October 2026. Every MSCI World company is also in ACWI, which is where the 89% comes from. World's 10-year lead comes from a decade in which emerging markets lagged badly. They returned 8.15% a year over those 10 years, according to the MSCI Emerging Markets factsheet, and the order flipped in 2025, when EM gained 33.57% and ACWI beat World 22.34% to 21.09%. ACWI is also ahead over one year and so far in 2026.
Adding emerging markets raises the tech weight slightly: ACWI holds 31.18% in information technology, World 29.84%. If you already own a World fund and plan to add an ACWI fund "to diversify", you'd be buying about 94% of the same developed-market companies again. To check your own pair of funds, the free ETF overlap calculator compares every holding from the funds' SEC filings where it has them, otherwise their published top holdings and sector splits, no sign-up.
How much URTH and ACWI overlap
- URTH and ACWIabout 88% by weight · 1,269 holdings in common
Every holding, from each fund's SEC filing (Form N-PORT): URTH as of August 31, 2026; ACWI as of July 31, 2026. Where a pair's funds report on different dates, its figure is approximate.
Opens with these funds in equal parts. Put in your own to see every company you hold twice.
Check your own fundsMSCI World vs MSCI ACWI in one table
"MSCI AC World", "MSCI All Country World" and "MSCI ACWI" are one and the same index. ACWI is also the sum of two other MSCI indices. World's $89.6 trillion of market cap plus Emerging Markets' $11.3 trillion gives ACWI's $100.9 trillion, and 1,248 plus 1,165 constituents gives 2,413 (World, EM, ACWI factsheets). The table also includes FTSE All-World, the index behind Vanguard's VWCE (FTSE Russell factsheet).
| As of 30 Oct 2026 | MSCI World | MSCI ACWI | FTSE All-World |
|---|---|---|---|
| Markets | 23 developed | 23 developed + 24 emerging | Developed + emerging (South Korea counted as developed) |
| Constituents | 1,248 | 2,413 | 4,200 |
| Index market cap | $89.6T | $100.9T | $103.8T |
| Emerging markets weight | 0% | 11.19% | 9.59% |
| US weight | 72.77% | 64.63% | 62.70% |
| Top 10 holdings | 26.58% | 24.26% | 23.75% |
| Cheapest UCITS ETF (TER) | SPPW / SWRD 0.12% | SSAC / ISAC 0.20% | VWCE / VWRA 0.14% |
| US-listed ETF (TER) | URTH 0.24% | ACWI 0.32% | none; VT (0.06%) tracks FTSE Global All Cap |
The EM weight for ACWI is computed from MSCI's own market caps (11,288,378 / 100,900,112 in USD millions), since the factsheet only lists the largest countries. FTSE's EM share is computed the same way from its developed and emerging totals.
Which emerging markets make up the extra 11%
MSCI's 24 emerging markets are Brazil, Chile, China, Colombia, the Czech Republic, Egypt, Greece, Hungary, India, Indonesia, Korea, Kuwait, Malaysia, Mexico, Peru, the Philippines, Poland, Qatar, Saudi Arabia, South Africa, Taiwan, Thailand, Turkey and the UAE. Most of the weight sits in four of them: inside the MSCI Emerging Markets index, Taiwan is 28.88%, China 20.00%, South Korea 19.66% and India 11.73%, about 80% of the index together. One company, TSMC, is 15.87% of the whole EM index on its own.
Multiply those EM weights by ACWI's 11.19% and you get each market's share of ACWI. Every developed country shrinks by the same factor, since World is 88.81% of ACWI. That is why the US goes from 72.77% to 64.63% and Japan from 5.72% to 5.08%.
| Country, % of index | MSCI World | MSCI ACWI | FTSE All-World |
|---|---|---|---|
| United States | 72.77 | 64.63 | 62.70 |
| Japan | 5.72 | 5.08 | 5.93 |
| United Kingdom | 3.52 | 3.12 | 3.18 |
| Canada | 3.44 | 3.06 | 3.07 |
| Taiwan | 0 | 3.23 | 3.31 |
| China | 0 | 2.24* | 2.53 |
| South Korea | 0 | 2.20* | 2.25 |
| India | 0 | 1.31* | 1.54 |
*Derived as MSCI EM country weight x 11.19%; the same method reproduces ACWI's published US, Japan, Canada and Taiwan weights exactly. Sources: MSCI World, MSCI ACWI, MSCI EM, FTSE All-World.
 Data: MSCI World, MSCI ACWI and MSCI Emerging Markets factsheets and FTSE All-World factsheet, data as of 30 Oct 2026; ACWI China, South Korea and India weights derived as MSCI EM weight x 11.19% EM share.
US and tech weight in World vs ACWI
Switching from World to ACWI lowers your US weight by about 8 points and leaves your tech weight slightly higher. Information technology is 41.77% of the EM index, so ACWI ends up with 31.18% in IT against World's 29.84% (ACWI and World factsheets). ACWI's top five are Apple 5.02%, NVIDIA 4.66%, Microsoft 3.65%, Amazon 2.31% and then TSMC 1.78%. In ACWI, Apple and NVIDIA weigh slightly less than in World, and TSMC enters the top five.
A 64.63% US weight reflects the share of the world's listed large and mid-cap value that sits in US companies. Underweighting it is an active call against the market's price. Listing country also overstates the geography: S&P 500 companies earned about 42.9% of their sales outside the US, and tech companies about 58.2% (S&P Dow Jones Indices, 2018 data). Swapping World for ACWI lowers the US weight by about 8 points; lowering it further takes a separate fund chosen for that purpose. The S&P 500 concentration piece and the US vs international home-bias post go through the US weight in more detail.
How much do they overlap?
Overlap by weight between two funds is the sum, across every stock both hold, of the smaller of its two weights. Every MSCI World stock is in ACWI, at a weight scaled down by the ratio of the two index sizes. So for each shared stock the smaller weight is its ACWI weight. Add those up and you get World's share of ACWI: $89.6 trillion divided by $100.9 trillion, or 88.81%. MSCI doesn't publish this number; it comes straight from the market caps in MSCI's World and ACWI factsheets. The remaining 11.19% of ACWI is emerging markets, which a World fund never holds.
The table adds a portfolio split 50/50 between a World ETF and an ACWI ETF.
| Portfolio | In MSCI World companies | In emerging markets |
|---|---|---|
| 100% MSCI World ETF | 100% | 0% |
| 100% MSCI ACWI ETF | 88.81% | 11.19% |
| 50% World ETF + 50% ACWI ETF | 94.41% | 5.59% |
A 50/50 split is 0.5 + 0.5 x 0.8881 = 94.41% the same developed-market companies, with a 5.59% EM sleeve, half of what a single ACWI fund would give you. Real ETFs drift a little from the index figure because some hold only a sample of the index. The iShares ACWI UCITS fund holds 1,659 lines against the index's 2,413.
On the pre-built VWCE vs IWDA comparison (data 10 November 2026), which uses each fund's published top 10 holdings and sector split, the two funds share 9 of their 10 biggest holdings and overlap 97.9% by sector; TSMC in VWCE's top 10 and Tesla in IWDA's are the only difference.
Which has performed better?
Over 10 years World has the edge, over 1 and 3 years ACWI does, and since 2000 they are within a tenth of a point. All figures are MSCI net total returns in USD, annualised, to 30 October 2026 (World, ACWI, EM).
| Annualised, % | 1y | 3y | 5y | 10y | Since Dec 2000 |
|---|---|---|---|---|---|
| MSCI World | 12.11 | 22.28 | 10.49 | 12.95 | 7.40 |
| MSCI ACWI | 12.33 | 22.30 | 10.10 | 12.39 | 7.31 |
| MSCI Emerging Markets | 14.05 | 22.28 | 6.92 | 8.15 | 8.73 |
Calendar years show where the gap came from: EM lost 2.54% in 2021 while World made 21.82%, and it trailed again in 2023 and 2024 before jumping 33.57% in 2025.
| Calendar year, % | 2021 | 2022 | 2023 | 2024 | 2025 |
|---|---|---|---|---|---|
| MSCI World | 21.82 | -18.14 | 23.79 | 18.67 | 21.09 |
| MSCI ACWI | 18.54 | -18.36 | 22.20 | 17.49 | 22.34 |
| MSCI Emerging Markets | -2.54 | -20.09 | 9.83 | 7.50 | 33.57 |
Risk barely differs: over 10 years the standard deviation is 14.86% for World and 14.73% for ACWI, and both had their worst fall in the same window, 31 October 2007 to 9 March 2009: -57.82% for World, -58.38% for ACWI (World, ACWI factsheets).
The gap in money at $500 a month
The table below assumes $500 invested at the end of every month, compounded at each index's annualised return from the table above (monthly rate = (1 + r)^(1/12) - 1). These are index returns before fund fees and taxes. Applying an average rate to monthly deposits shows the scale of the gap; the exact historical path would differ.
| Period to 30 Oct 2026 | Paid in | MSCI World | MSCI ACWI | MSCI EM | World minus ACWI |
|---|---|---|---|---|---|
| 5 years | $30,000 | $38,736 | $38,373 | $35,529 | $363 |
| 10 years | $60,000 | $116,651 | $113,263 | $90,765 | $3,388 |
| 25 years (since Dec 2000) | $150,000 | $415,466 | $409,940 | $507,535 | $5,527 |
 Data: $500/month invested end-of-month, MSCI World, ACWI and EM annualised net USD returns to 30 Oct 2026 (5y 10.49/10.10/6.92%, 10y 12.95/12.39/8.15%, since Dec 2000 7.40/7.31/8.73%), before fund fees and taxes.
Over ten years World came out $3,388 ahead on $60,000 paid in, about 3% more than the ACWI plan's ending value. Over 25 years the gap is $5,527, and emerging markets on their own beat both, since EM's 8.73% a year from December 2000 tops World's 7.40%. Fees between the cheapest all-world funds move the result by less: at ACWI's 12.39%, the gap between VWCE (0.14%) and SSAC (0.20%) on the same 10-year plan is about $350.
For euro, koruna or pound investors both indices are mostly dollar assets; the extra 11% adds Taiwanese dollars, yuan, won and rupees. The hedged vs unhedged world ETF post covers the currency question for both.
MSCI World plus an EM fund vs one ACWI fund
Since ACWI is World plus EM, you can rebuild it with two funds at 88.8% World and 11.2% EM. Blended TER = 0.8881 x World fund TER + 0.1119 x EM fund TER, with TERs checked on the issuer pages on 11 November 2026.
| Route | Funds | TER |
|---|---|---|
| Two funds, UCITS | IWDA / SWDA 0.20% + EIMI 0.18% | 0.198% blended |
| Two funds, UCITS | SPPW / SWRD 0.12% + EIMI 0.18% | 0.127% blended |
| One fund, UCITS | SSAC / ISAC (MSCI ACWI) | 0.20% |
| One fund, UCITS | SPYI (MSCI ACWI IMI, adds small caps) | 0.17% |
| One fund, UCITS | VWCE / VWRA (FTSE All-World) | 0.14% |
| Two funds, US | URTH 0.24% + IEMG 0.09% | 0.223% blended |
| One fund, US | ACWI | 0.32% |
| One fund, US | VT (FTSE Global All Cap) | 0.06% |
The iShares pair (0.198%) costs the same as SSAC (0.20%) to two decimals. The SPDR World fund plus EIMI comes in at 0.127%, about a hundredth of a percentage point under VWCE. On the $500-a-month plan that is under $10 a year on average. EIMI and IEMG track the EM IMI index, which adds small caps, so the two-fund rebuild also holds EM small caps that ACWI leaves out. The split also drifts: in 2025 EM returned 33.57% against World's 21.09%, so a portfolio set at 89/11 in January ended the year noticeably heavier in EM, and you'd have to rebalance by hand.
Two funds make sense when you already hold a large World position and selling it would trigger tax: leave it alone and add EM with new money until the split looks right. They also let you set the EM weight yourself, at 5% or 20% instead of 11%. In a US account, URTH plus IEMG (0.223%) undercuts ACWI (0.32%), though VT at 0.06% undercuts both.
Where FTSE All-World and VT fit
FTSE All-World is FTSE Russell's version of ACWI: 4,200 constituents, 9.59% emerging markets and 62.70% US as of 30 October 2026 (FTSE Russell factsheet). The EM share is lower mainly because FTSE classes South Korea (2.25%) as developed, while MSCI still counts it as emerging. FTSE also includes a few markets MSCI leaves out, such as Iceland, Romania and Vietnam. Vanguard cut the TER on its FTSE All-World UCITS ETF (VWCE, VWRA, VWRL) from 0.19% to 0.14% from 28 July 2026 (Vanguard fee notice), the lowest TER among the European one-fund options in the table above.
VT is Vanguard's US-listed world fund from its FTSE range. It tracks FTSE Global All Cap, small caps included, holds 10,185 stocks and costs 0.06% (Vanguard VT fact sheet). For a US investor it covers the same markets as ACWI, plus small caps, at about a fifth of ACWI's 0.32% fee; the VT vs VTI vs VOO comparison goes through it fund by fund. The EU's PRIIPs regulation requires a key information document before a fund is sold to retail investors (Regulation (EU) No 1286/2014, Articles 5 and 13). US-listed ETFs such as VT don't publish one, so most EU brokers don't offer them to retail clients, and European investors tend to use VWCE or SPYI. The best world ETFs list compares the UCITS options with accumulating and distributing share classes.
Which one should you pick?
For one fund covering the whole market, the cheapest options are VWCE or VWRA (0.14%), SPYI (0.17%) and SSAC (0.20%) in Europe, and VT (0.06%) in the US. An ACWI or FTSE All-World fund gives you 62.70% to 64.63% US, 9.59% to 11.19% emerging markets and one line to buy every month.
MSCI World also works as a core holding: it returned 12.95% a year over the last decade across 1,248 companies. It fits if you'll pair it with an EM fund and rebalance once a year, or if you want developed markets only, with the 72.77% US weight that comes with them.
Holding World and ACWI side by side at 50/50 means paying for two funds that are 94.41% the same. If you hold both, there is no need to sell: stop buying one of them and send new money to the other.
The portfolio analysis tool unpacks each ETF you hold into its underlying companies and shows your combined US weight, your emerging-markets share and which stocks you hold twice.
Frequently asked questions
- Does MSCI World include emerging markets?
- No. MSCI World covers 23 developed countries and 1,248 companies, so China, Taiwan, India, South Korea and the other emerging markets are 0% of it. MSCI ACWI is the version that adds them: it is World plus the 24 emerging markets, which made up 11.19% of ACWI's market value on 30 October 2026, according to MSCI's factsheets.
- Is MSCI ACWI better than MSCI World?
- Neither wins on every period: to 30 October 2026, World returned 12.95% a year over 10 years against 12.39% for ACWI, but ACWI led over one and three years and in 2025, when emerging markets gained 33.57%. Since December 2000 they are 7.40% versus 7.31%. ACWI is the simpler one-fund choice; World suits investors who add an emerging-markets fund themselves.
- Should I hold both an MSCI World and an MSCI ACWI ETF?
- No. Every MSCI World company is also in ACWI, so the two overlap about 89% by weight. A 50/50 split puts 94.41% of your money in the same developed-market companies and only 5.59% in emerging markets, while you pay for two funds. If you hold both, stop buying one and direct new money to the other; there is no need to sell.
- Is FTSE All-World the same as MSCI ACWI?
- Nearly: both cover developed and emerging markets, and FTSE All-World holds about 4,200 stocks against ACWI's 2,413 and counts South Korea as developed, so its emerging-markets share is 9.59% versus 11.19%. US weight is 62.70% versus 64.63% as of 30 October 2026.
- What percentage of MSCI ACWI is the US?
- 64.63% as of 30 October 2026, per MSCI's ACWI factsheet, against 72.77% in MSCI World. Japan is next at 5.08%, then Taiwan at 3.23%, the UK at 3.12% and Canada at 3.06%. Adding emerging markets lowers the US share by about 8 points but raises the technology weight slightly, from 29.84% to 31.18%.
Free Financial Tools
Stay updated
Get notified when we publish new articles.
Related posts
Dividend vs Growth Stocks: Same Return, Different Tax Bill
Dividend vs growth stocks: at the same total return, the dividend payer can leave you ~13% poorer after 25 years of tax; a tax-free wrapper erases the gap.
VOO vs QQQ vs SCHD: VOO and QQQ Overlap 52%, Which to Own
VOO and QQQ overlap by about 52% of weight; VOO and SCHD share about 8%. Ten-year returns, the 2022 falls, and which of the three to own.
VT vs VTI vs VOO: Whole World, All US, or S&P 500?
VOO is the S&P 500, VTI all of the US, VT the whole world. The real choice is how much non-US stock you want. Here's what each one holds, by the numbers.