FTSE All-World Index: What You Actually Own
 Dennis Vymer
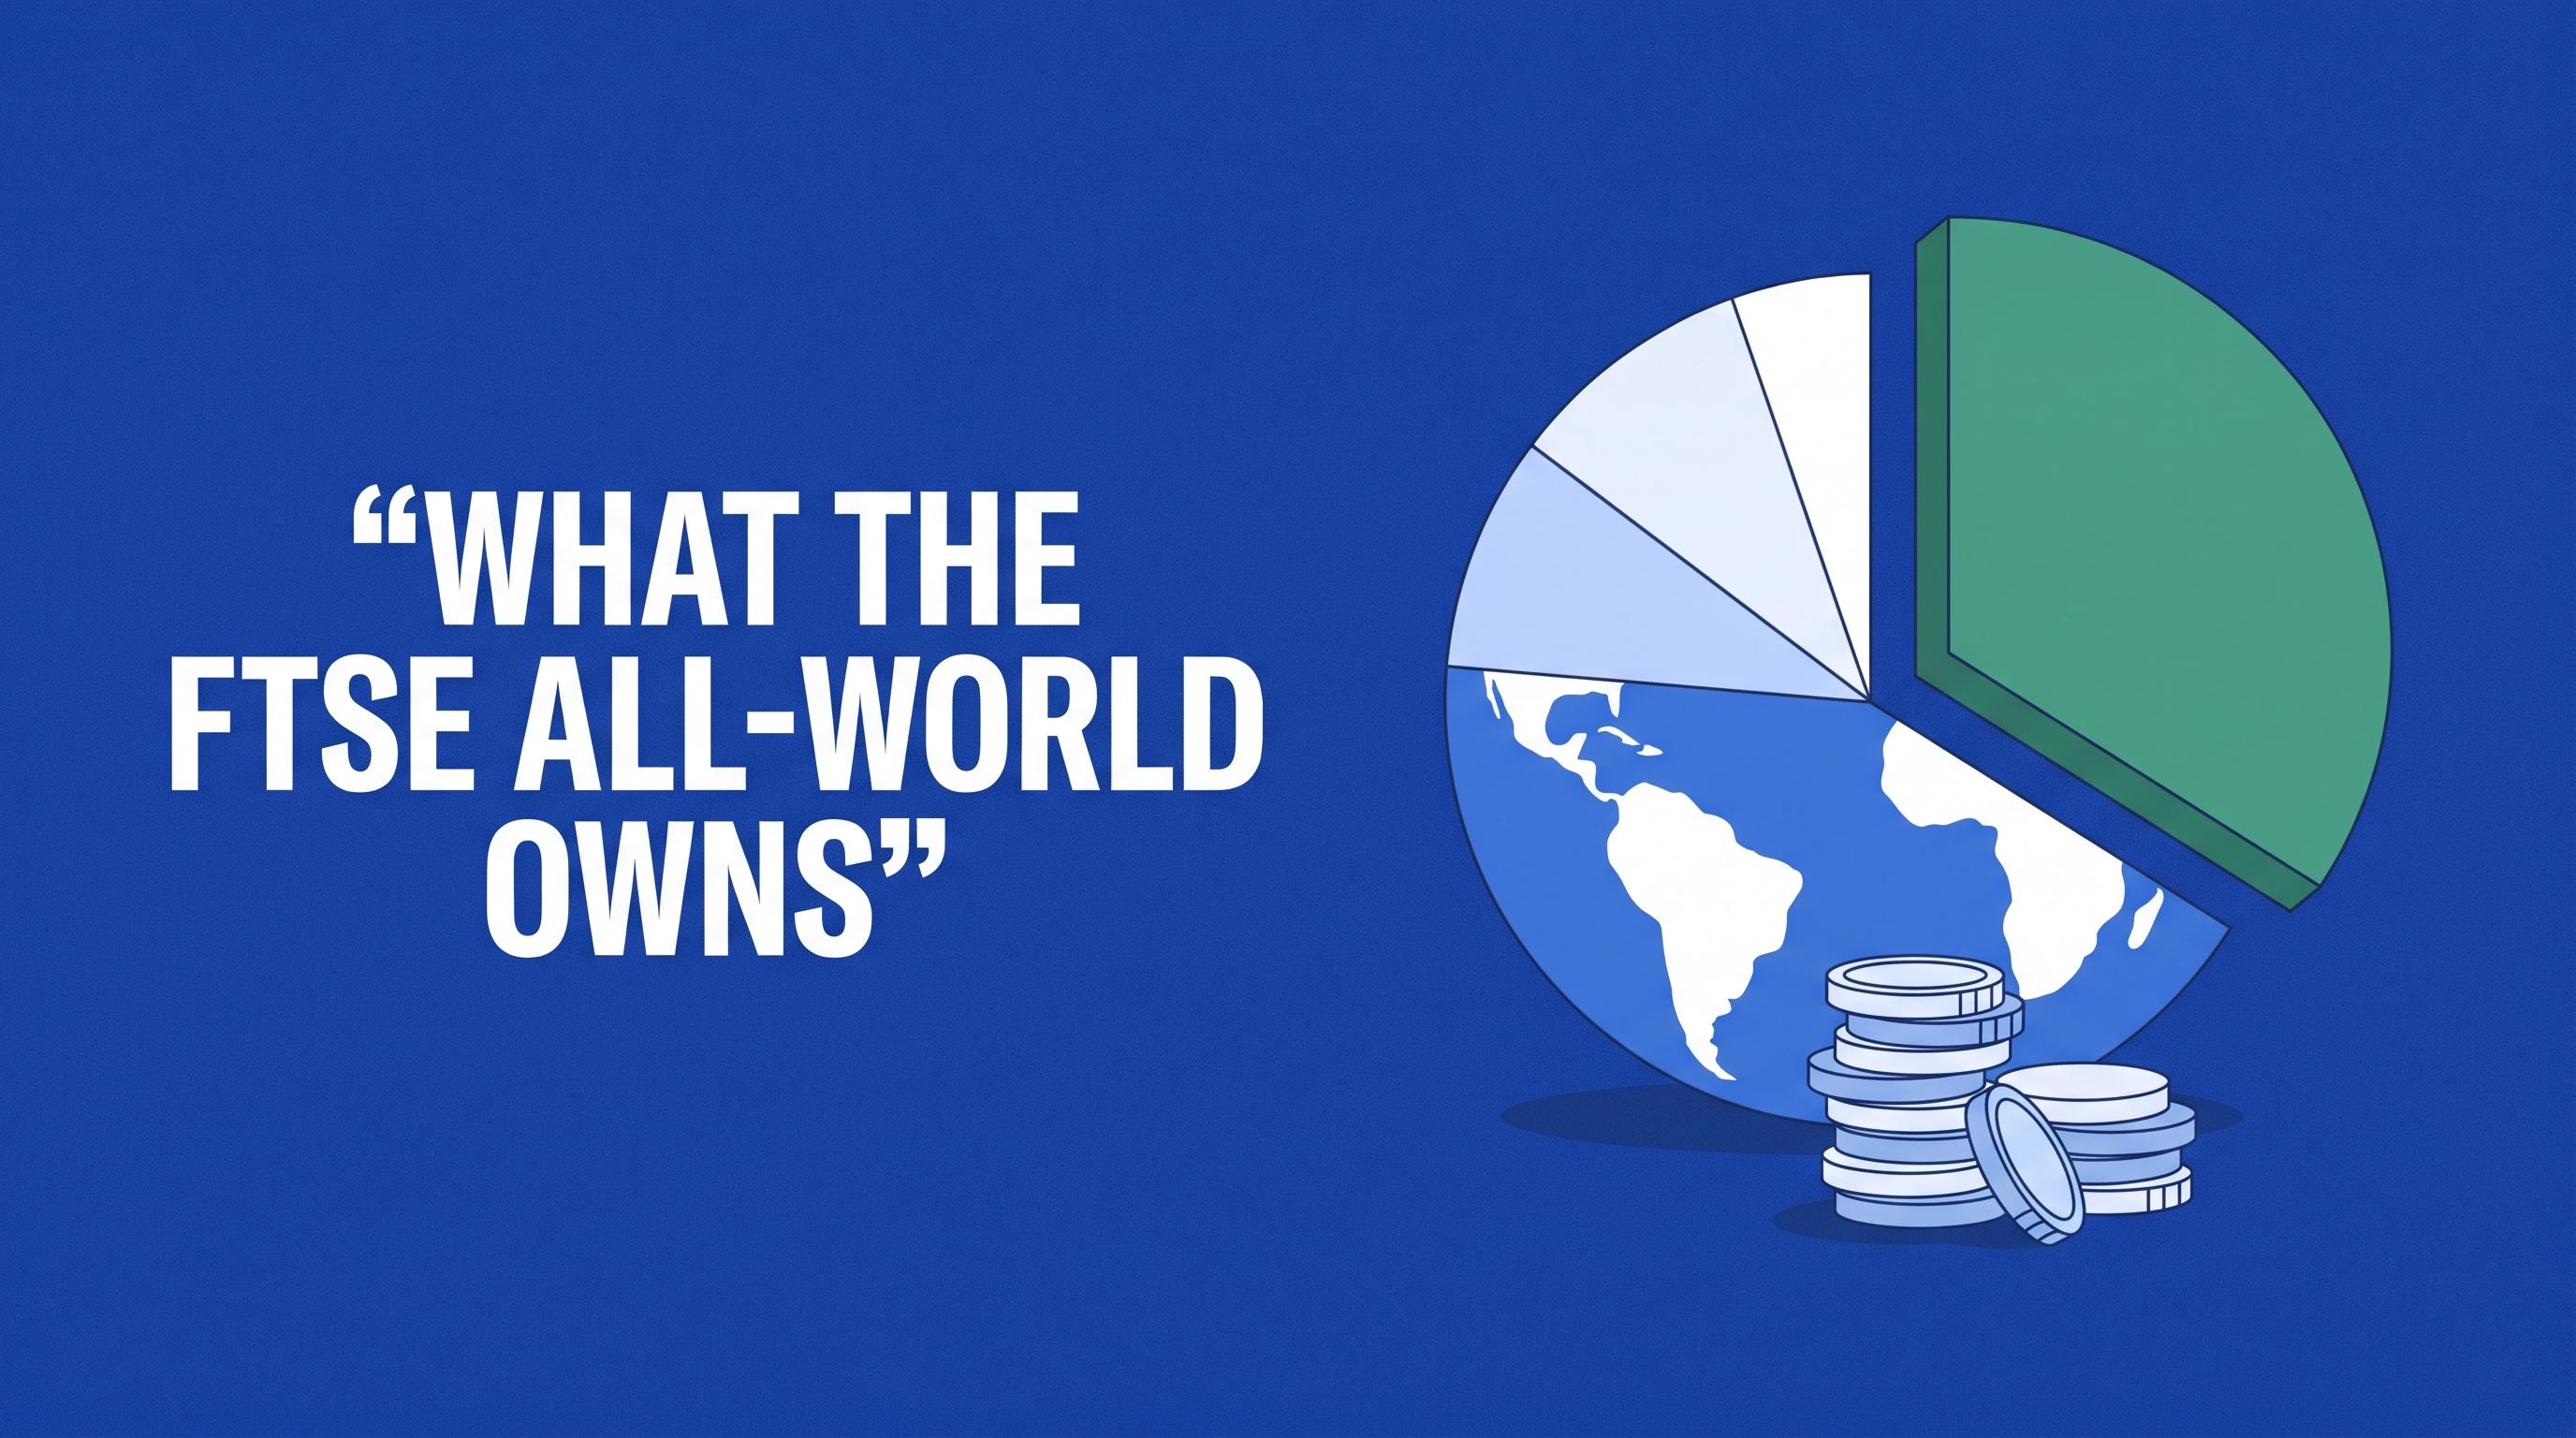
The FTSE All-World is a market-cap-weighted index of about 4,200 large and mid-cap stocks in 49 developed and emerging countries, covering roughly 90% of the world's investable shares. The US is about 63% of it, the top 10 companies about a quarter and emerging markets about a tenth, per FTSE Russell's factsheet of 30 October 2026.
You buy it through funds such as Vanguard's VWCE (accumulating) or VWRL (distributing), and whether it is "diversified enough" depends on how much else you hold that is US large-cap. An estimated 56% to 61% of the All-World is made of S&P 500 companies, so an S&P 500 ETF bought next to VWCE mostly adds more of what is already inside. A 70/30 split of VWCE and an S&P 500 fund lifts the US share from 62.7% to 73.9%, which is above the 72.77% in the MSCI World factsheet, an index with no emerging markets at all. You can check your own funds' country split in the free portfolio analysis tool, no sign-up.
What is the FTSE All-World index?
It is one slice of FTSE Russell's global equity series. "All-World" means large and mid caps only: FTSE ranks companies by free-float market value and aims to cover 90% of each of its 9 regions, then reviews the list every March and September (factsheet). On 30 October 2026 that produced 4,200 stocks, 1,902 from developed markets and 2,298 from emerging ones, with a combined net market value of about USD 103.8 trillion. Each company's weight is its share of that total, so a $4 trillion company counts a thousand times more than a $4 billion one.
Small caps are left out; add them and you get the FTSE Global All Cap, roughly 10,200 stocks, which is the index Vanguard's US-listed VT has tracked since December 2011 (VT factsheet).
FTSE's country labels also differ from MSCI's in a way that shows up in the weights. FTSE counts South Korea and Poland as developed, and in 2025 FTSE announced that Greece would move to developed status, effective September 2026 (LSEG announcement). MSCI World's 23 developed countries include none of the three, so a "developed vs emerging" split is never quite comparable between the two families.
FTSE All-World by country: where your money goes
Weights don't depend on currency, so the euro split is the percentage split, before fund costs and cash. Figures from the FTSE factsheet of 30 October 2026:
| Country | Weight | Of every €1,000 |
|---|---|---|
| USA | 62.70% | €627 |
| Japan | 5.93% | €59 |
| Taiwan | 3.31% | €33 |
| UK | 3.18% | €32 |
| Canada | 3.07% | €31 |
| China | 2.53% | €25 |
| South Korea | 2.25% | €23 |
| Switzerland | 2.08% | €21 |
| France | 1.90% | €19 |
| Germany | 1.83% | €18 |
| Other 39 countries | 11.22% | €112 |
 Data: FTSE Russell, FTSE All-World factsheet, 30 October 2026.
All of Europe, UK and Switzerland included, adds up to 13.74%, or €137. Australia gets €16 and India €15. The other 39 countries share €112 between them, an average of under €3 each.
Emerging markets supply 2,298 of the 4,200 stocks, more than half, yet only 9.59% of the money, so €96 of your €1,000. China alone has 1,315 constituents and gets €25. Developed markets take the other €904.
Top holdings and sectors
Ten companies, 0.24% of the stock count, carry 23.75% of the index:
| # | Company | Country | Weight | Of every €1,000 |
|---|---|---|---|---|
| 1 | Apple | USA | 4.79% | €47.90 |
| 2 | Nvidia | USA | 4.59% | €45.90 |
| 3 | Microsoft | USA | 3.73% | €37.30 |
| 4 | Amazon | USA | 2.24% | €22.40 |
| 5 | TSMC | Taiwan | 1.70% | €17.00 |
| 6 | Alphabet A | USA | 1.57% | €15.70 |
| 7 | Broadcom | USA | 1.46% | €14.60 |
| 8 | Meta Platforms | USA | 1.30% | €13.00 |
| 9 | Alphabet C | USA | 1.27% | €12.70 |
| 10 | Tesla | USA | 1.12% | €11.20 |
| Top 10 | 23.75% | €237.50 |
Source: FTSE factsheet, 30 October 2026. Apple, Nvidia and Microsoft alone are 13.11%, or €131. Alphabet appears twice because it has two listed share classes; together they are 2.84%. Vanguard's VWCE factsheet merges them into one 2.8% line, which pushes Eli Lilly (1.1%) into its top 10 and puts the fund's top 10 at 24.9%.
By sector, FTSE uses the ICB classification:
| Industry | Stocks | Weight | Of every €1,000 |
|---|---|---|---|
| Technology | 502 | 33.43% | €334 |
| Financials | 643 | 15.10% | €151 |
| Industrials | 792 | 12.23% | €122 |
| Consumer Discretionary | 537 | 10.92% | €109 |
| Health Care | 297 | 8.80% | €88 |
| Energy | 183 | 4.62% | €46 |
| Consumer Staples | 280 | 4.17% | €42 |
| Telecommunications | 128 | 3.18% | €32 |
| Basic Materials | 399 | 3.15% | €32 |
| Utilities | 233 | 2.68% | €27 |
| Real Estate | 206 | 1.72% | €17 |
ICB files Alphabet and Meta under Technology but puts Amazon with retailers and Tesla with carmakers, so a provider using GICS (MSCI, S&P) shows a different tech number for the same companies.
Nine of the top 10 companies are American, yet the All-World's top 10 at 23.75% is lighter than MSCI World's 26.58% and far lighter than the S&P 500's 37.3% (S&P 500 factsheet). And "US" describes where a company is listed, not where it sells: S&P Dow Jones Indices puts the US share of S&P 500 revenue at 57.8% as of 30 September 2026 (S&P DJI), so roughly 42% of what those companies earn already comes from abroad. A fall in a handful of US tech prices still moves the whole fund, the same concentration that makes an S&P 500 index fund less diversified than it looks.
How much of the FTSE All-World is the S&P 500?
Neither FTSE nor S&P publishes this figure, and no full, same-date holdings lists for both indices were available, so the share is estimated from factsheet weights with one formula:
S&P 500 share of the All-World = US weight × c
The US weight is 62.70%. The unknown, c, is the part of the All-World's US slice (483 stocks) that sits in S&P 500 companies, and two checks bracket it:
- Coverage (low end). The S&P 500 covers about 80% of US market value according to S&P Dow Jones Indices; the All-World aims for 90%. If one basket sits inside the other, c ≈ 80 / 90 = 0.89.
- Size match (high end). Apple is 7.7% of the S&P 500 and 4.79 / 62.70 = 7.64% of the All-World's US slice. Both indices weight by free-float value, so the two US baskets must be almost the same size. Rescaling the other US top-10 names the same way gives 37.25% for the S&P 500's top 10, against 37.3% on its factsheet. The remaining gap is the US companies FTSE includes but the S&P committee rejects (it requires profits, for one) and the smallest S&P members that FTSE files as small caps, a few percent on each side. That puts c at 0.93 to 0.97.
| c (assumed) | S&P 500 stocks in the All-World | Of every €1,000 |
|---|---|---|
| 0.89 (low) | 55.8% | €558 |
| 0.93 (central) | 58.3% | €583 |
| 0.97 (high) | 60.8% | €608 |
Roughly €560 to €610 of every €1,000 in VWCE is therefore in S&P 500 companies, central estimate about €583.
Worked example: 70% VWCE + 30% S&P 500 ETF
Each line in the table is 0.7 × the All-World figure + 0.3 × the S&P 500 figure. S&P weights for single names other than Apple are derived from the FTSE weights with the same 7.7 / 7.64 scale, and VWCE is taken to match its index (its one-year return was 12.29% against the index's 12.21%, per the VWCE factsheet).
| 100% All-World | 70/30 mix | 100% S&P 500 | |
|---|---|---|---|
| US share | 62.7% | 73.9% | 100% |
| Apple + Nvidia + Microsoft | 13.1% | 15.5% | 21.1% |
| All-World top-10 names | 23.75% | 27.3% | 35.5% |
| Emerging markets | 9.6% | 6.7% | 0% |
| S&P 500 stocks (estimate) | 55.8–60.8% | 69.1–72.6% | 100% |
In money: of every €1,000 in the mix, about €739 sits in US companies and €155 in just Apple, Nvidia and Microsoft. Emerging markets drop to €67. A 30% second fund moved the US share 11 points, to slightly above MSCI World's 72.77%, and added 2.4 points to the top three names.
 Data: FTSE Russell and MSCI factsheets, 30 October 2026. Mix computed as 0.7 × 62.7% + 0.3 × 100%.
An S&P 500 fund next to VWCE adds no new companies and only shifts your weights toward the US, because all 503 of its companies are American (S&P 500 factsheet) and, by the c range above, an estimated 89–97% of the All-World's US slice by value is already S&P 500 stock.
FTSE All-World vs S&P 500 and MSCI World
| FTSE All-World | MSCI World | S&P 500 | |
|---|---|---|---|
| Stocks | 4,200 | 1,248 | 503 |
| Countries | 49 | 23 | 1 |
| US share | 62.70% | 72.77% | 100% |
| Emerging markets | 9.59% | 0% | 0% |
| Top 10 share | 23.75% | 26.58% | 37.3% |
| Apple weight | 4.79% | 5.65% | 7.7% |
Sources: FTSE, MSCI and S&P factsheets, all as of the end of October 2026.
Against the S&P 500, the All-World is roughly 58% S&P 500 companies, a few points of US firms the S&P committee leaves out, and about 37% outside the US: Japan, Europe, Canada and the emerging markets. Against MSCI World, it is closer to MSCI ACWI, since both include emerging markets and MSCI World leaves them out.
ETFs that track the FTSE All-World
| Fund | Index | Dividends | Yearly cost | Stocks held | ISIN |
|---|---|---|---|---|---|
| Vanguard VWCE | FTSE All-World | Reinvested | 0.14% | 3,574 | IE00BK5BQT80 |
| Vanguard VWRL | FTSE All-World | Paid quarterly | 0.14% | same fund | IE00B3RBWM25 |
| Invesco FWRA | FTSE All-World | Reinvested | 0.15% | 2,096 | IE000716YHJ7 |
| Vanguard VT (US-listed) | FTSE Global All Cap | Paid quarterly | 0.06% | 10,185 | n/a |
Sources: VWCE and VWRL factsheets (31 October 2026), Invesco FWRA factsheet and VT factsheet (30 September 2026).
VWCE and VWRL are two share classes of the same Irish fund, about USD 88.8 billion in total. Neither holds every stock in the index; they sample, which is why VWCE lists 3,574. Vanguard also sells the same fund as VWRA (USD listing) and VWRP (GBP). Invesco's version costs 0.01 points more and holds even fewer names. VT is also a Vanguard world fund, but it switched from the All-World to the All Cap index in December 2011, is aimed at US investors and differs from VWCE on costs, withholding tax and where it can be bought (VWCE vs VT).
The FTSE All-World index yielded 1.63% in dividends at the end of October, and the share class decides what reaches you. VWRL pays them out four times a year; VWCE keeps them inside and buys more shares, so its price carries them. Which works better depends on how your country taxes accumulating and distributing ETFs.
Is the FTSE All-World a good investment?
As a single core holding it works, with about 63% of the money in the US and weights that follow market value, so the companies that have grown biggest receive the most money. Cap weighting also means the index rebalances itself, with no trading by you, and the factsheet shows what holding it has looked like: 10.6% a year over five years in USD, a 17.7% loss in 2022, and a worst 10-year drawdown of 33.7%. Emerging markets beat developed ones in 2025 (26.5% vs 22.8%) and then trailed them badly over the last 12 months (4.3% vs 13.6%).
It is a weaker fit if you already own a lot of US large caps, through an S&P 500 fund, a US workplace plan or individual tech shares. Adding the All-World on top then spreads you less than the 4,200 stocks suggest, because 56–61% of it is the same companies.
Before you buy a second fund next to VWCE or VWRL, enter both, plus anything else you own, in the portfolio analysis tool and look at the US line in the country view. Its shared-holdings list is built from each fund's published top positions, so its company-level overlap is a floor, lower than the 56–61% estimate; the country view uses the full fund breakdown. If the US line reads higher than the 62.7% of the All-World alone, the second fund has raised your US share. VWCE, IWDA and the other world funds are compared side by side in the best world ETFs.
Frequently asked questions
- How many companies are in the FTSE All-World index?
- About 4,200. FTSE Russell's factsheet of 30 October 2026 lists 4,200 constituents, 1,902 from developed markets and 2,298 from emerging markets, across 49 countries. Only large and mid caps are included, and funds that track it sample rather than buy everything: Vanguard's VWCE held 3,574 stocks at the end of October 2026 and Invesco's FWRA about 2,096.
- How much of the FTSE All-World is the US?
- 62.70% on 30 October 2026, according to FTSE Russell's factsheet, so about €627 of every €1,000 goes to US companies. Japan is next at 5.93%, then Taiwan, the UK and Canada at around 3% each. Europe as a whole, including the UK and Switzerland, is 13.74%, and emerging markets together are 9.59%.
- Does the FTSE All-World pay dividends?
- The index yielded 1.63% at the end of October 2026, but what you receive depends on the fund. Vanguard's VWRL pays dividends out quarterly, while VWCE, the accumulating share class of the same fund, reinvests them so they show up in its price. Both cost 0.14% a year. Which suits you better mostly depends on how your country taxes each type.
- Is the FTSE All-World better than the S&P 500?
- The All-World is broader: it holds 4,200 stocks in 49 countries and its top 10 are 23.75% of the index, against 503 US stocks and 37.3% for the S&P 500. An estimated 56-61% of the All-World is S&P 500 companies anyway, so the two share most of their largest holdings. The All-World suits a one-fund portfolio; the S&P 500 is a deliberate bet on the US.
- What is the difference between FTSE All-World and FTSE Global All Cap?
- The difference is small caps: the FTSE All-World covers large and mid caps, about 4,200 stocks, while the FTSE Global All Cap adds small companies for roughly 10,200. Vanguard's VWCE and VWRL track the All-World. Vanguard's US-listed VT tracks the Global All Cap and has done since December 2011. VT charges 0.06% a year, against 0.14% for VWCE.
Free Financial Tools
Stay updated
Get notified when we publish new articles.
Related posts
VWCE vs VT: Which Vanguard World ETF Costs You Less?
US investors: VT, at 0.06% vs 0.14%. In the EU the all-in cost is near a tie (0.29% vs 0.31%), so access, dividend tax and estate rules favour VWCE.
MSCI World vs MSCI ACWI: What the Extra 11% Buys You
MSCI ACWI is MSCI World plus about 11% emerging markets. How much they overlap, what the return gap was worth, and when to pick each one.
Dividend vs Growth Stocks: Same Return, Different Tax Bill
Dividend vs growth stocks: at the same total return, the dividend payer can leave you ~13% poorer after 25 years of tax; a tax-free wrapper erases the gap.