Your Plan Now Shows Numbers You Can Actually Believe
 Dennis Vymer

Last weekend the new plan graph in MFFT started talking in nine figures. Somewhere around the 300 million range, late in life.
Nobody believes a number like that. I didn't either. So I spent a good part of the week finding out why. The answer was embarrassing, and the fix changed every plan in the app, probably yours too.
Your plan, with honest maths
Financial Future used to be a pile of tiles. Now it opens on the one answer most people come for: the age when work becomes optional, how many years away that is, and whether you're on track. If you're behind, it doesn't just say so. It offers two things to try, like stopping a bit later or saving a bit more each month.
Under that sit five steps on the way: Coast FIRE, Barista, Lean, Work optional and Comfortable, each with its age and a bar showing how far along you are. New to those names? Here's how a FIRE number is worked out.
Then one graph, from today to the end of your plan, with your life events on it. A second baby, a parental leave, a sabbatical, a kid going to college. Each event says what it does to you: "8 months later", or "$40K less at 90" when it doesn't move the date. And nothing you try gets saved until you press Keep, so you can play with "what if I stop at 46?" without wrecking your real plan.
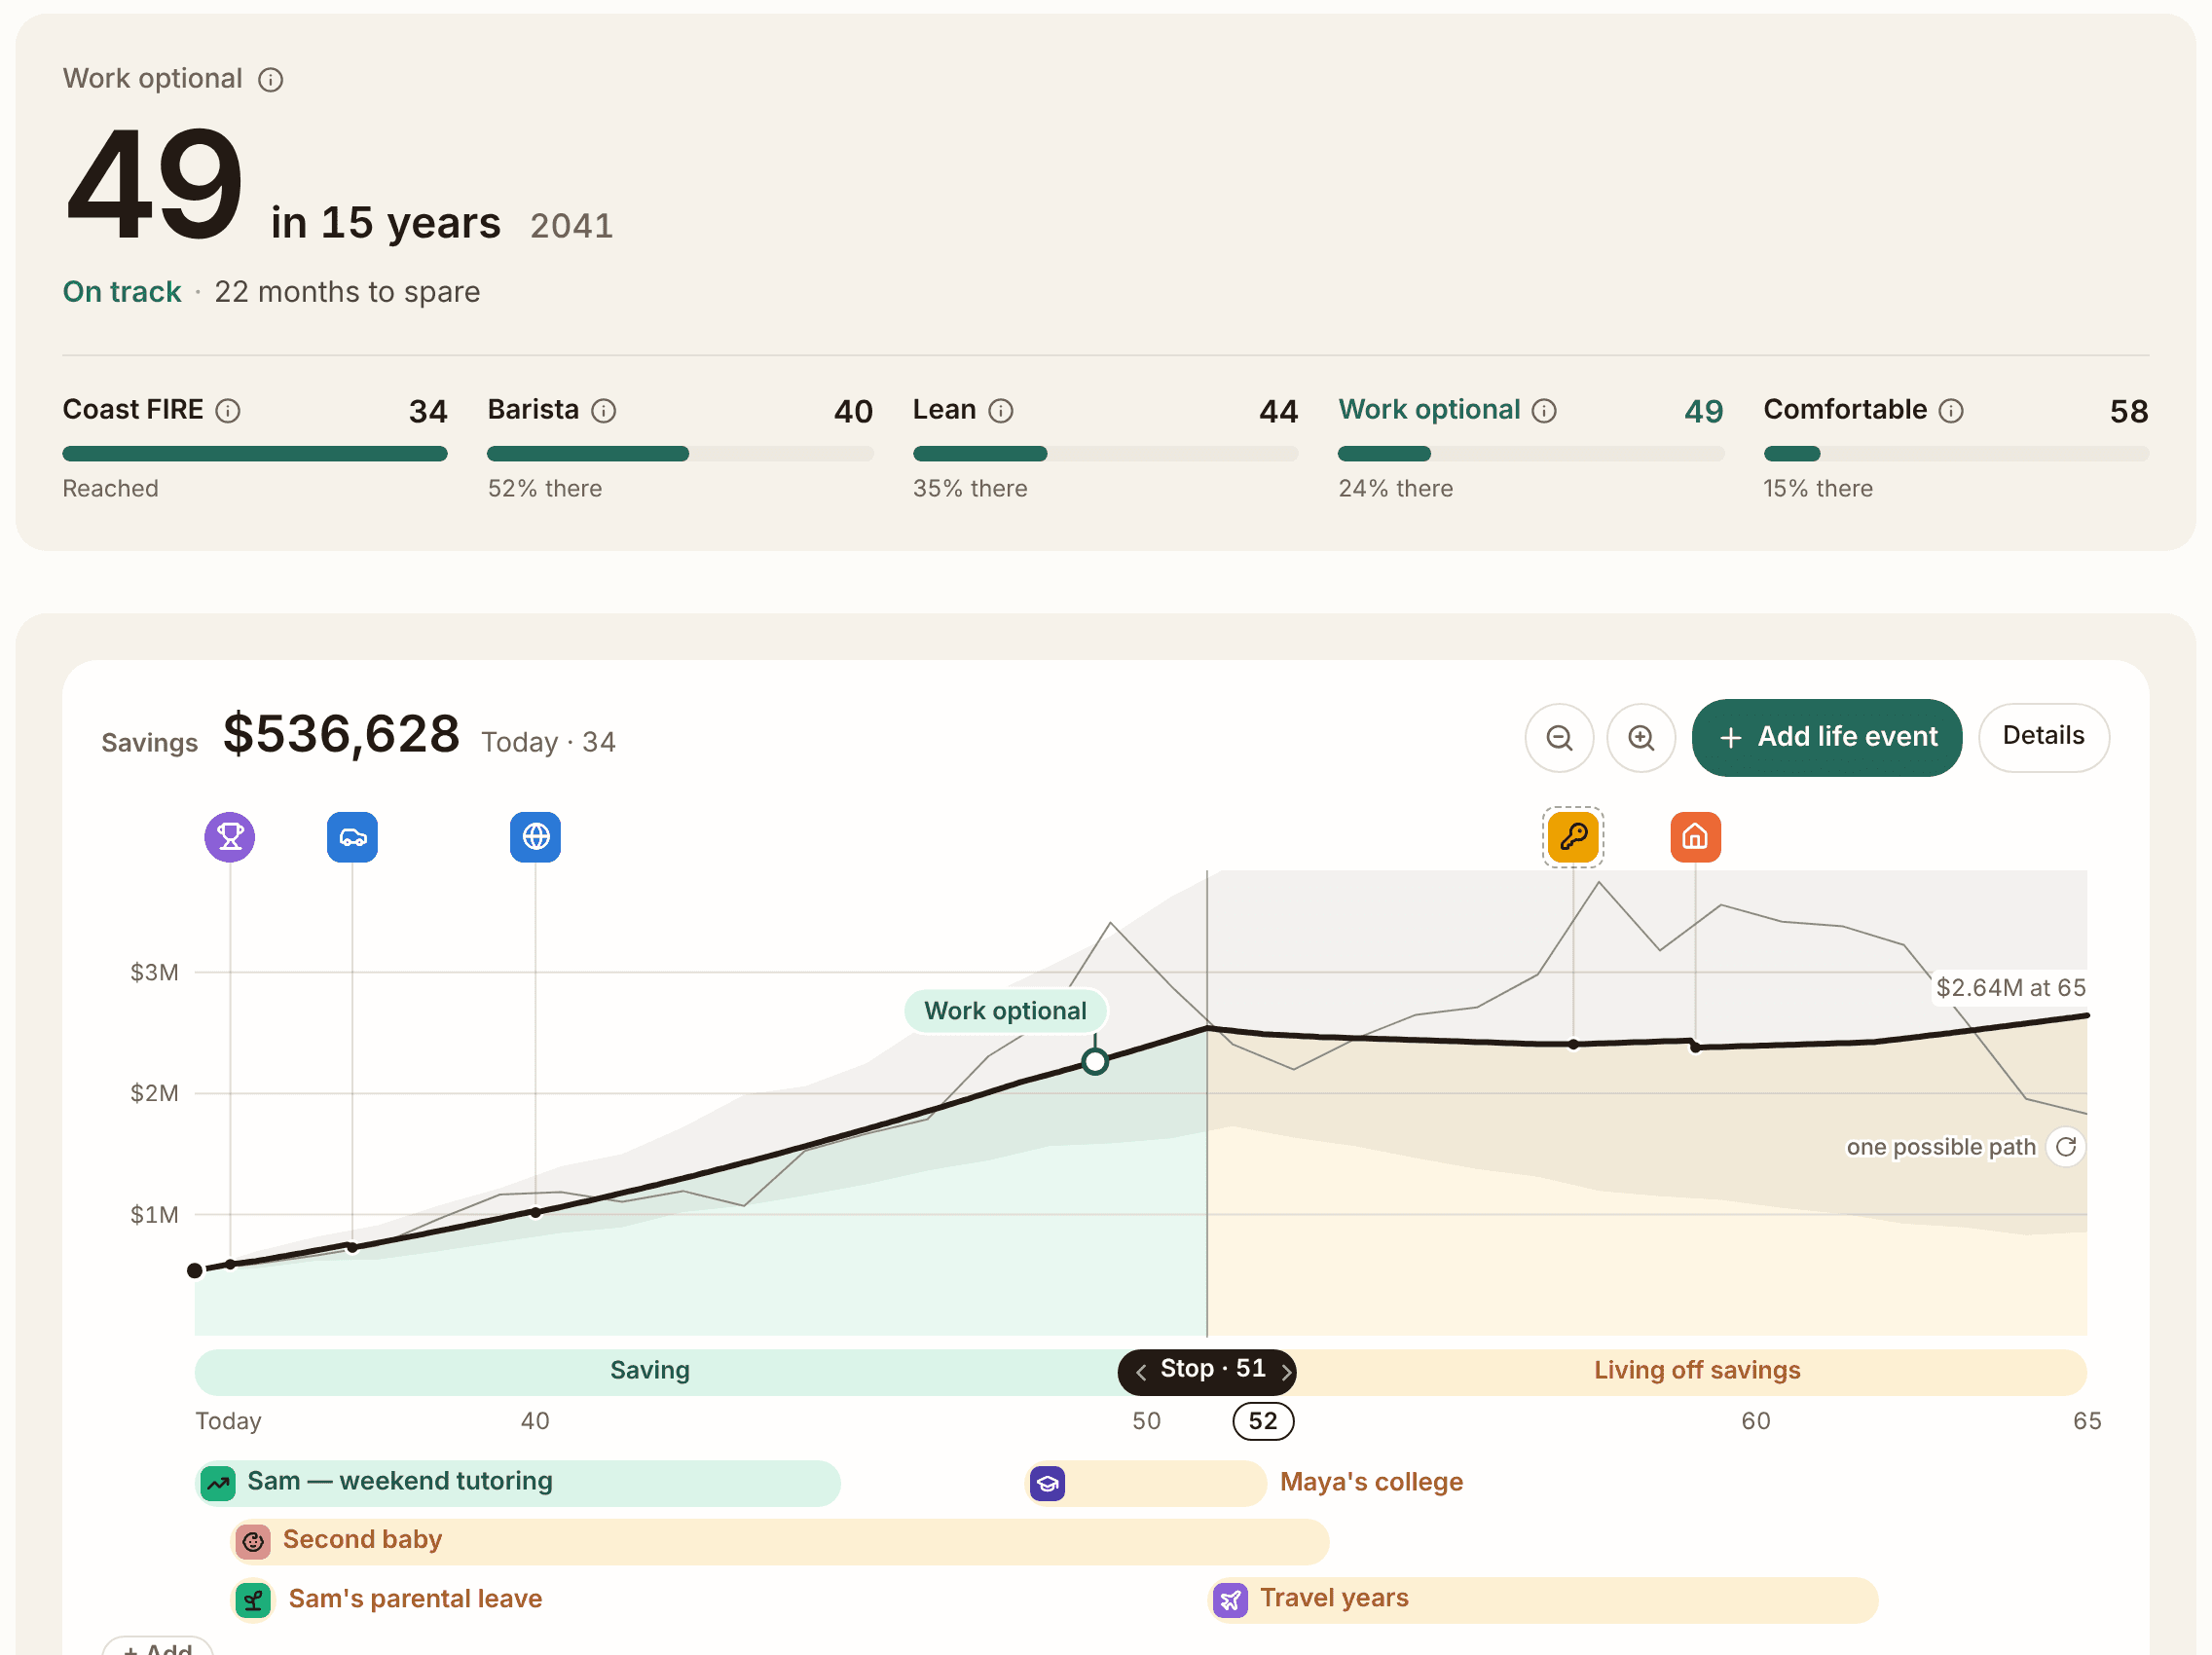
Now the embarrassing part. The app takes a growth figure, 11% by default, and that figure means an average year. But the old maths compounded 11% every single year, as if markets never had a bad one. After inflation that's over 8% a year, for fifty years. For comparison, US stocks returned about 6.6% a year after inflation since 1900. World stocks, about 5.2%.
Ups and downs cost you something even when the average stays the same. Lose 20% and then gain 20%, and you're not back where you started. The plan now accounts for that. And once you stop working, your money grows at a calmer rate, the kind you'd get from a mix of stocks and bonds, because most people don't live off a 100% stock portfolio at 70.
One more bug made me wince: the old simulation treated each account as a separate bet, so splitting the same money over more accounts raised your chance of success. Real life disagrees. Now the app does too.
So when you open your plan, work-optional may sit one to three years later, and late-life balances will look smaller. That's not the app getting worse. It's the app stopping lying to you.
The demo has a full household ready. Drag the "Stop working at" slider and watch the date move.
X-ray: what your funds actually hold
The Portfolio page has a new tab called X-ray, born from one reader's email. First you get "How your funds overlap": your biggest funds drawn as circles, and every pair that holds the same companies. If you own a total-market fund and a tech fund, you'll see how much of the second one you already owned through the first.
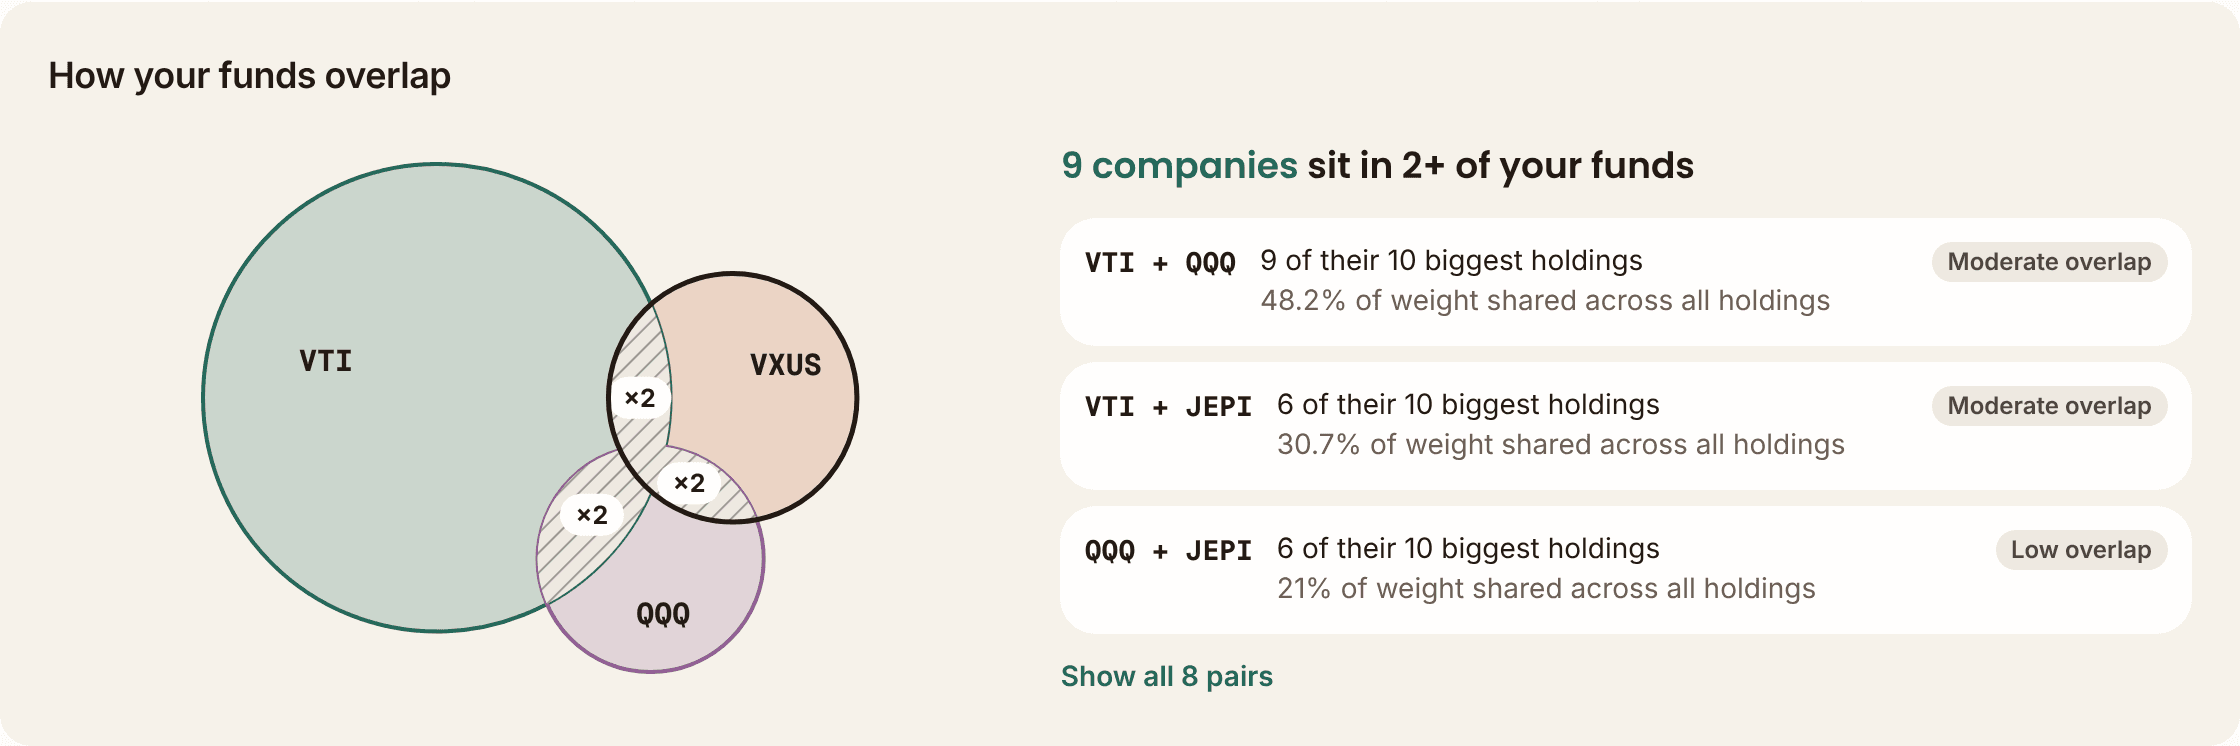
Below that, "Ways to pay less" looks for a cheaper fund that follows the same index, and shows what the fee difference adds up to over 30 years. If you like the idea, it opens your rebalancing plan with that fund for new buys. Nothing gets sold. Don't care? Press Ignore and it stops asking.
For US funds, X-ray now sees the whole list of what they hold, not just the top ten. VTI went from 10 lines to over 3,500. Turns out a fund that owns everything really does own everything.
Numbers that were wrong, now right
A reader saw VWCE at 24% technology in the app while Vanguard's own page said 36%. He was right. So I checked every figure the app shows for the 1,459 most popular stocks and ETFs. 203 of them had at least one wrong figure. Now it's one.
Smaller fixes from your emails, same week:
- A statement import no longer turns a symbol it read correctly into a different company.
- The cash balance printed on your broker statement now gets imported too.
- A zero-fee fund shows 0%, not 0.91%.
- Paying off your own credit card no longer counts as spending in your budget.
I skipped last week's update, so one catch-up: two weeks ago I said a tax view was next. It's there now: a Tax dates tile under Profit & taxes lists your purchases by the day each one passes your country's holding test.
What's next
Marking accounts as what they are: a Roth, a 401(k), an ISA, a Czech DIP, so the plan treats each one the way your tax rules do. And more for the tax view: this year's figures, plus losses you can still use.
The lesson
Of those wrong figures, a lot came from tables I typed by hand. I added them to be safe, because I trusted myself more than the data feeds. 40 of 108 hand-typed figures were wrong. The live data was fine. My safety net was the hole.
Go open your plan this week. If the date moved, I'd love to hear how that felt.
Free Financial Tools
Stay updated
Get notified when we publish new articles.
Related posts
You Can Now Ask Your Money a Question
Ask your money a question and get a plain answer whose numbers come from the app, never the AI. Plus a Subscriptions page and Goals that fill as you save.
Your Bank Statement Now Imports While You Do Something Else
The bank statement import is rebuilt: drop the file, keep working, answer once per merchant instead of per row. Your partner can now have their own login.
Your Rebalancing Plan Won't Tell You to Sell a 1% Holding
A week of fixes from reader emails: decimal targets, purchases you can see in Profit & taxes, no imaginary rent on your home, and overlap badges.